Download Queste statistiche in altri paesi:
Linea del tempo:
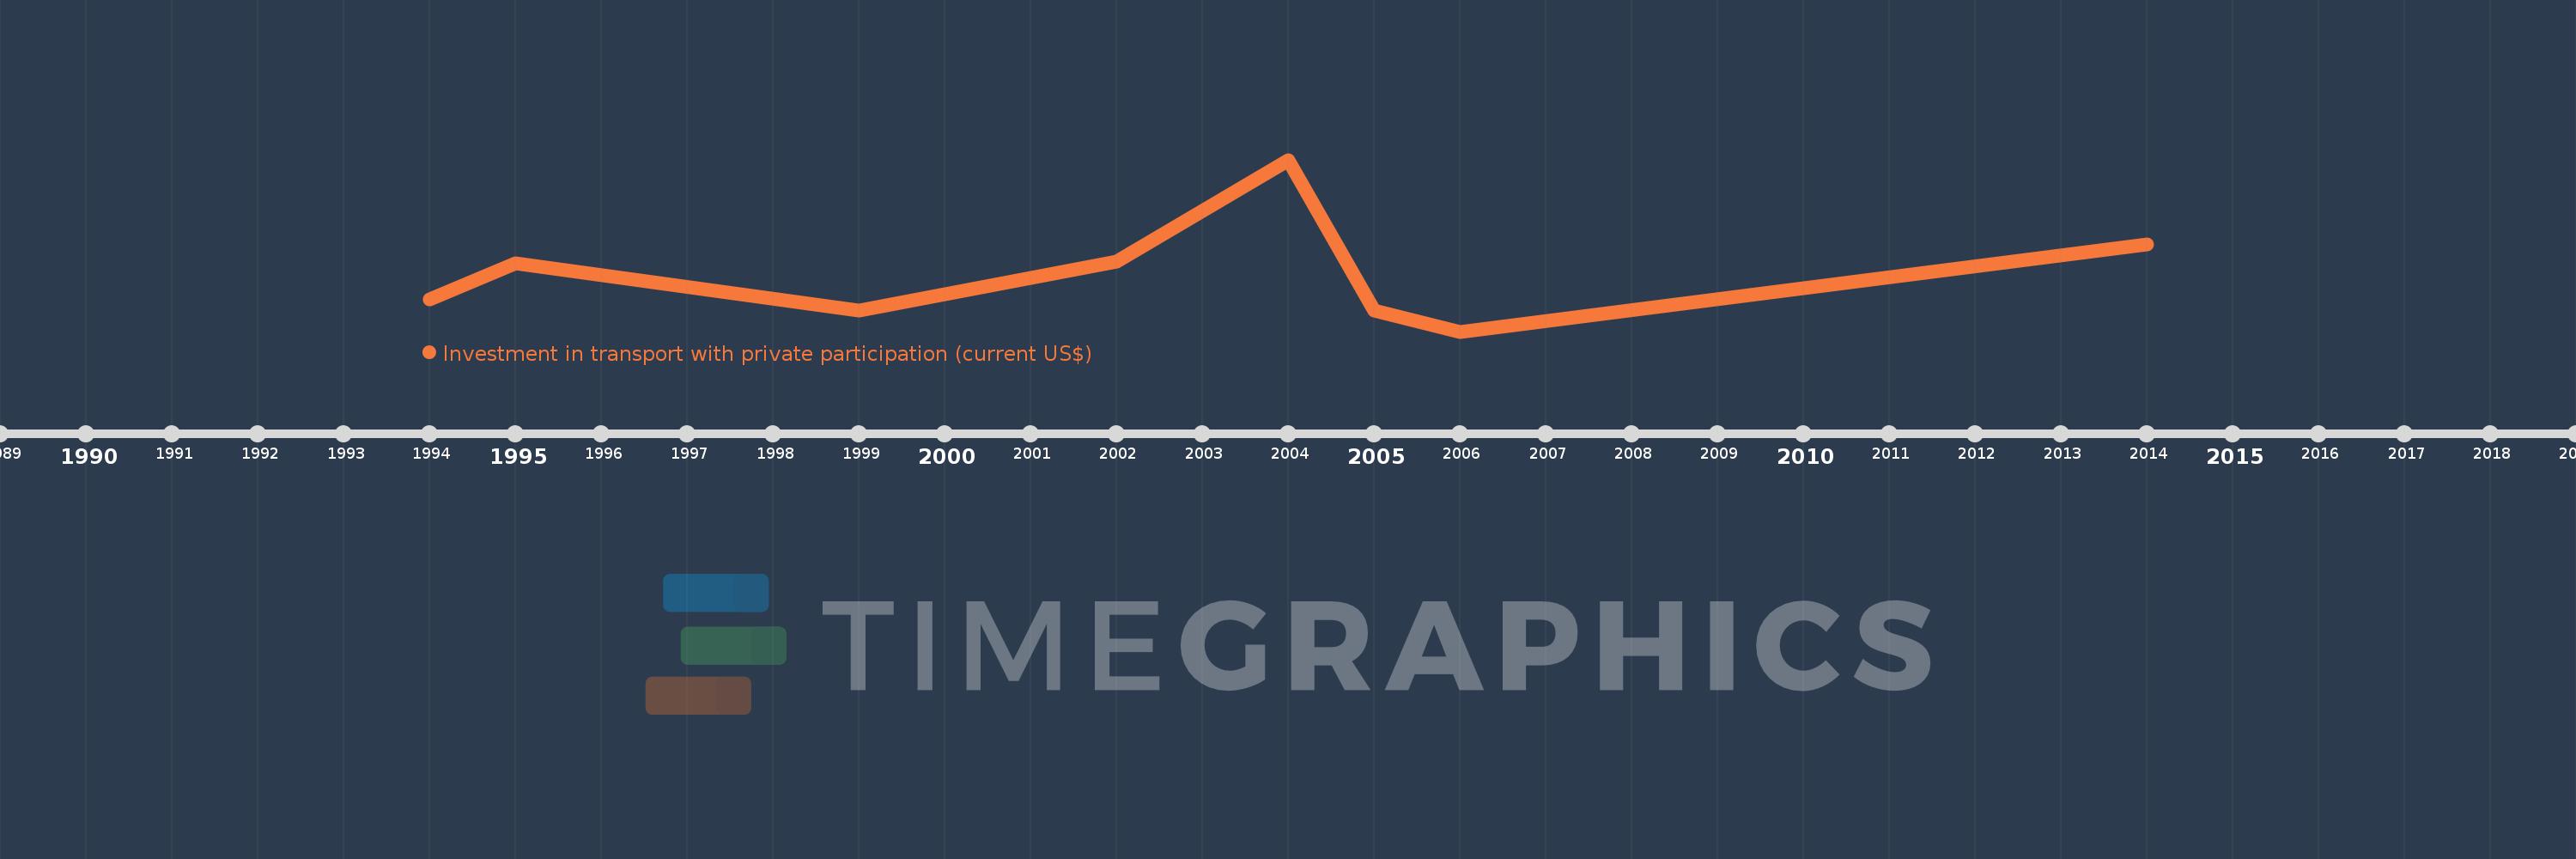
Questa scala temporale mostra un grafico dal 1994 anno al 2014 anno. Uruguay. I dati fino ad 1993 anno non disponibili. Il numero di osservazioni attuali secondo i date: 8.
La fonte (nome):
Indicatori dello sviluppo mondiale
La fonte (organizzazione):
World Bank, Private Participation in Infrastructure Project Database (http://ppi.worldbank.org).
Categorie:
Infrastructure, Private Sector
sono stati aggiornati
23 apr 2017 anni
Indicatori delle variazioni dei valori per anni
Minima:
0.0
1 gen 2006 anni
Massimo:
164.0 Mln
1 gen 2004 anni
Alla data di osservazione
Valore
Variazione assoluta
La variazione rispetto al valore precedente
1 gen 1994 anni
31.0 Mln
+31.0 Mln
0.0%
1 gen 1995 anni
65.0 Mln
+34.0 Mln
109.68%
1 gen 1999 anni
20.0 Mln
-45.0 Mln
-69.23%
1 gen 2002 anni
67.1 Mln
+47.1 Mln
235.5%
1 gen 2004 anni
164.0 Mln
+96.9 Mln
144.41%
1 gen 2005 anni
20.0 Mln
-144.0 Mln
-87.8%
1 gen 2006 anni
0.0
-20.0 Mln
-100.0%
1 gen 2014 anni
83.0 Mln
+83.0 Mln
%
Classificazione dei paesi secondo i statistiche attuali per anni