Download Queste statistiche in altri paesi:
Linea del tempo:
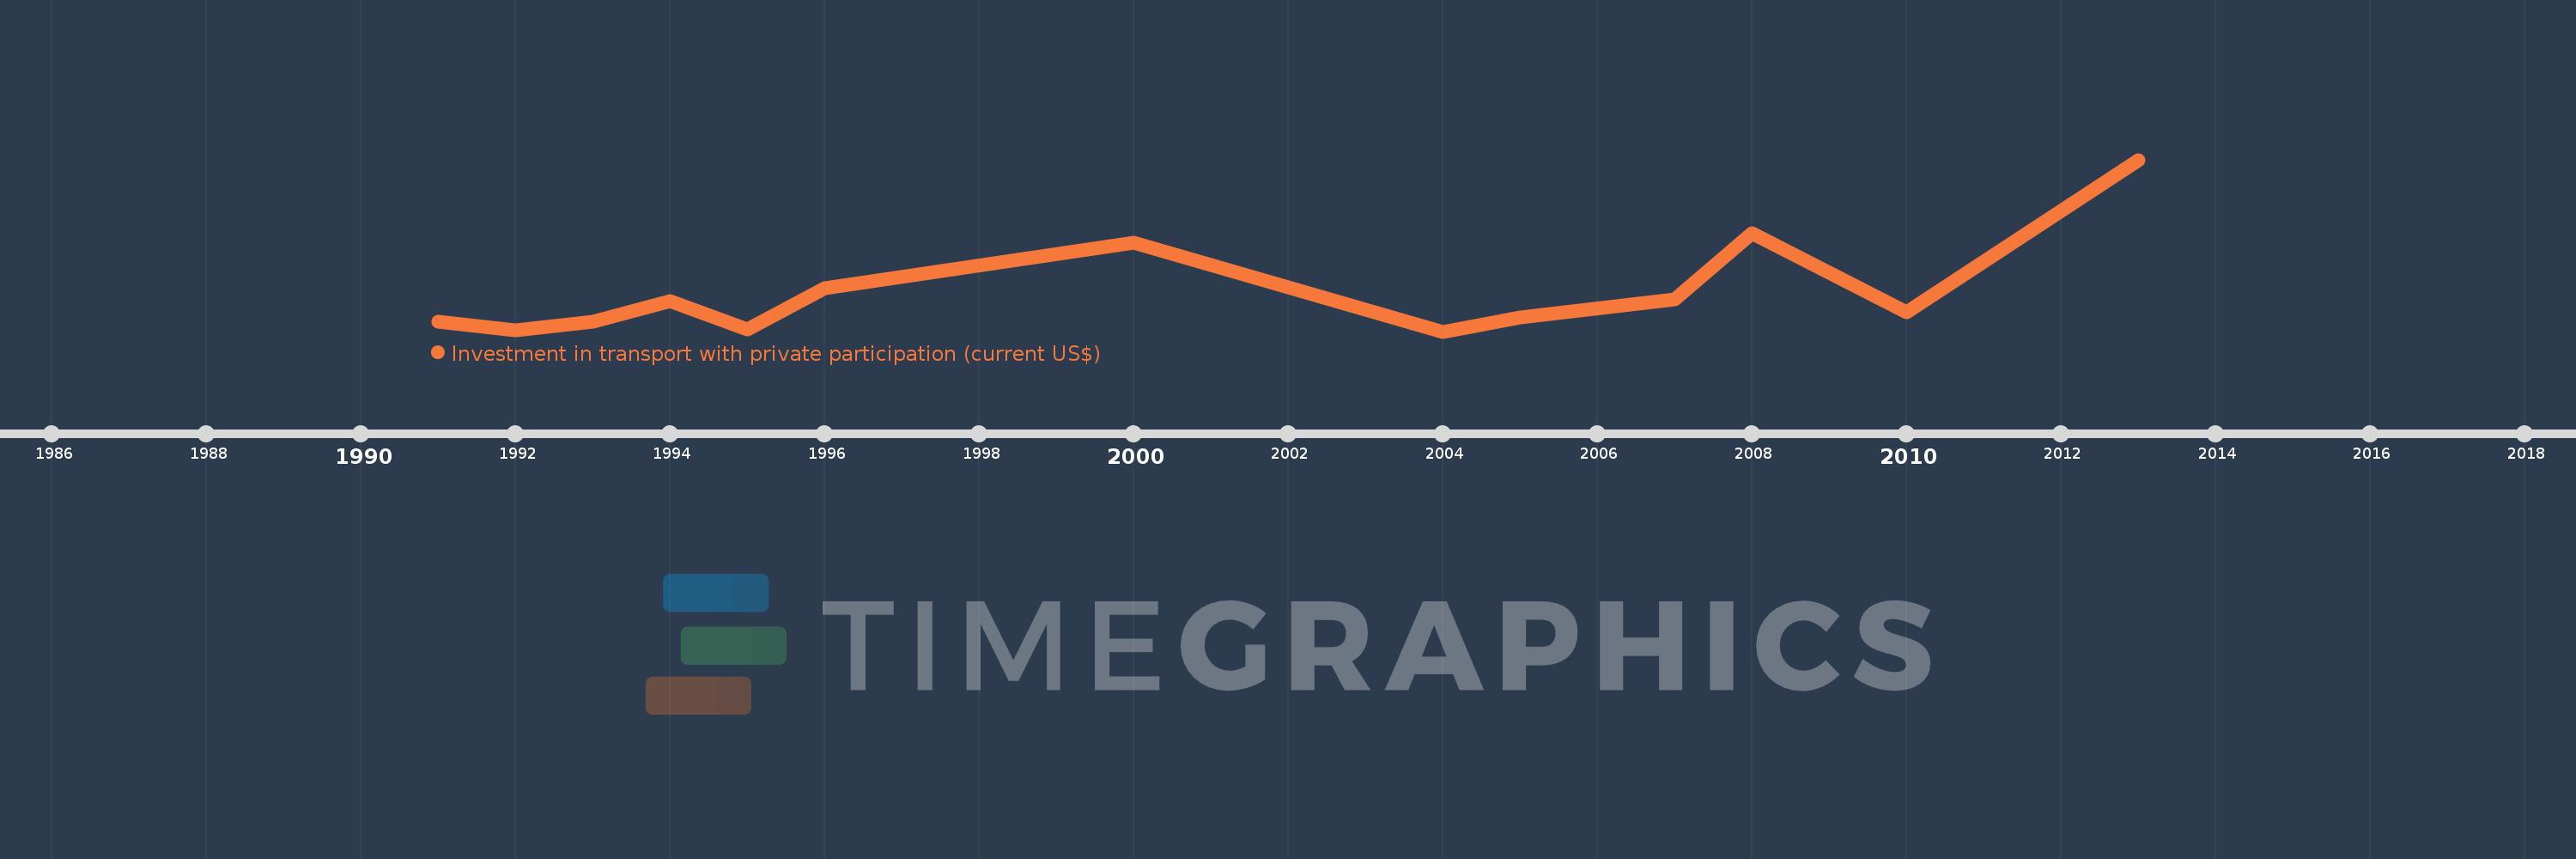
Questa scala temporale mostra un grafico dal 1991 anno al 2013 anno. Indonesia. I dati fino ad 1990 anno non disponibili. Il numero di osservazioni attuali secondo i date: 13.
La fonte (nome):
Indicatori dello sviluppo mondiale
La fonte (organizzazione):
World Bank, Private Participation in Infrastructure Project Database (http://ppi.worldbank.org).
Categorie:
Infrastructure, Private Sector
sono stati aggiornati
23 apr 2017 anni
Indicatori delle variazioni dei valori per anni
Minima:
0.0
1 gen 2004 anni
Massimo:
1.988 Mlrd
1 gen 2013 anni
Alla data di osservazione
Valore
Variazione assoluta
La variazione rispetto al valore precedente
1 gen 1991 anni
116.0 Mln
+116.0 Mln
0.0%
1 gen 1992 anni
10.8 Mln
-105.2 Mln
-90.69%
1 gen 1993 anni
114.5 Mln
+103.7 Mln
960.19%
1 gen 1994 anni
351.5 Mln
+237.0 Mln
206.99%
1 gen 1995 anni
26.7 Mln
-324.8 Mln
-92.4%
1 gen 1996 anni
502.8 Mln
+476.1 Mln
1.78 Mille.%
1 gen 2000 anni
1.028 Mlrd
+525.2 Mln
104.46%
1 gen 2004 anni
0.0
-1.028 Mlrd
-100.0%
1 gen 2005 anni
159.2 Mln
+159.2 Mln
%
1 gen 2007 anni
372.0 Mln
+212.8 Mln
133.67%
1 gen 2008 anni
1.139 Mlrd
+767.5 Mln
206.32%
1 gen 2010 anni
220.0 Mln
-919.5 Mln
-80.69%
1 gen 2013 anni
1.988 Mlrd
+1.768 Mlrd
803.86%
Classificazione dei paesi secondo i statistiche attuali per anni