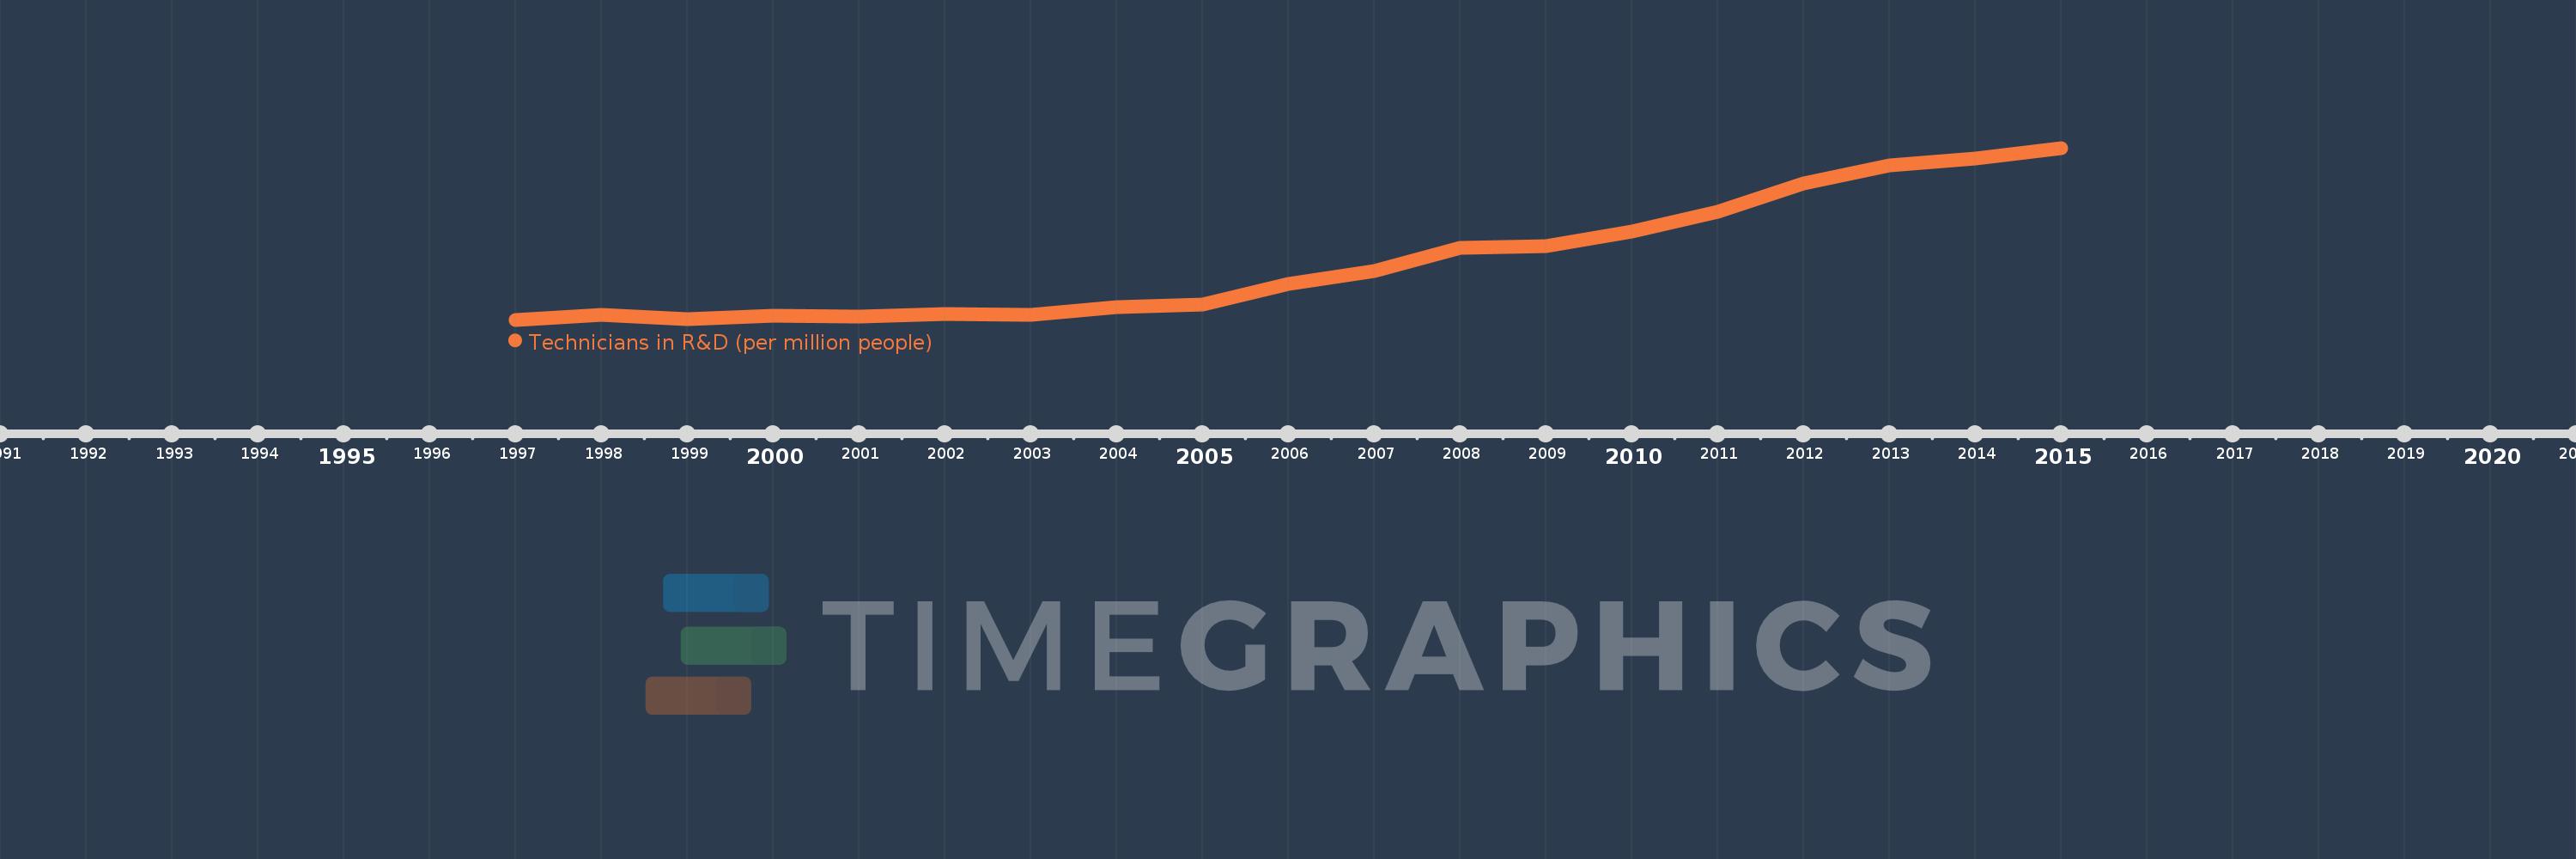
Questa scala temporale mostra un grafico dal 1997 anno al 2015 anno. Turkey. I dati fino ad 1996 anno non disponibili. Il numero di osservazioni attuali secondo i date: 19.
La fonte (nome):
Indicatori dello sviluppo mondiale
La fonte (organizzazione):
United Nations Educational, Scientific, and Cultural Organization (UNESCO) Institute for Statistics.
Categorie:
Science & Technology
sono stati aggiornati
23 apr 2017 anni
Indicatori delle variazioni dei valori per anni
In media:
92.678
Minima:
34.213
1 gen 1997 anni
Massimo:
207.469
1 gen 2015 anni
Alla data di osservazione
Valore
Variazione assoluta
La variazione rispetto al valore precedente
1 gen 1997 anni
34.213
+34.213
0.0%
1 gen 1998 anni
39.292
+5.079
14.85%
1 gen 1999 anni
35.146
-4.146
-10.55%
1 gen 2000 anni
38.06
+2.915
8.29%
1 gen 2001 anni
37.334
-0.727
-1.91%
1 gen 2002 anni
39.886
+2.552
6.84%
1 gen 2003 anni
39.416
-0.47
-1.18%
1 gen 2004 anni
46.806
+7.39
18.75%
1 gen 2005 anni
49.89
+3.084
6.59%
1 gen 2006 anni
70.038
+20.149
40.39%
1 gen 2007 anni
83.32
+13.282
18.96%
1 gen 2008 anni
106.737
+23.417
28.1%
1 gen 2009 anni
108.208
+1.471
1.38%
1 gen 2010 anni
123.118
+14.91
13.78%
1 gen 2011 anni
143.158
+20.04
16.28%
1 gen 2012 anni
172.078
+28.92
20.2%
1 gen 2013 anni
189.519
+17.441
10.14%
1 gen 2014 anni
197.197
+7.678
4.05%
1 gen 2015 anni
207.469
+10.271
5.21%
Classificazione dei paesi secondo i statistiche attuali per anni