Download Queste statistiche in altri paesi:
Linea del tempo:
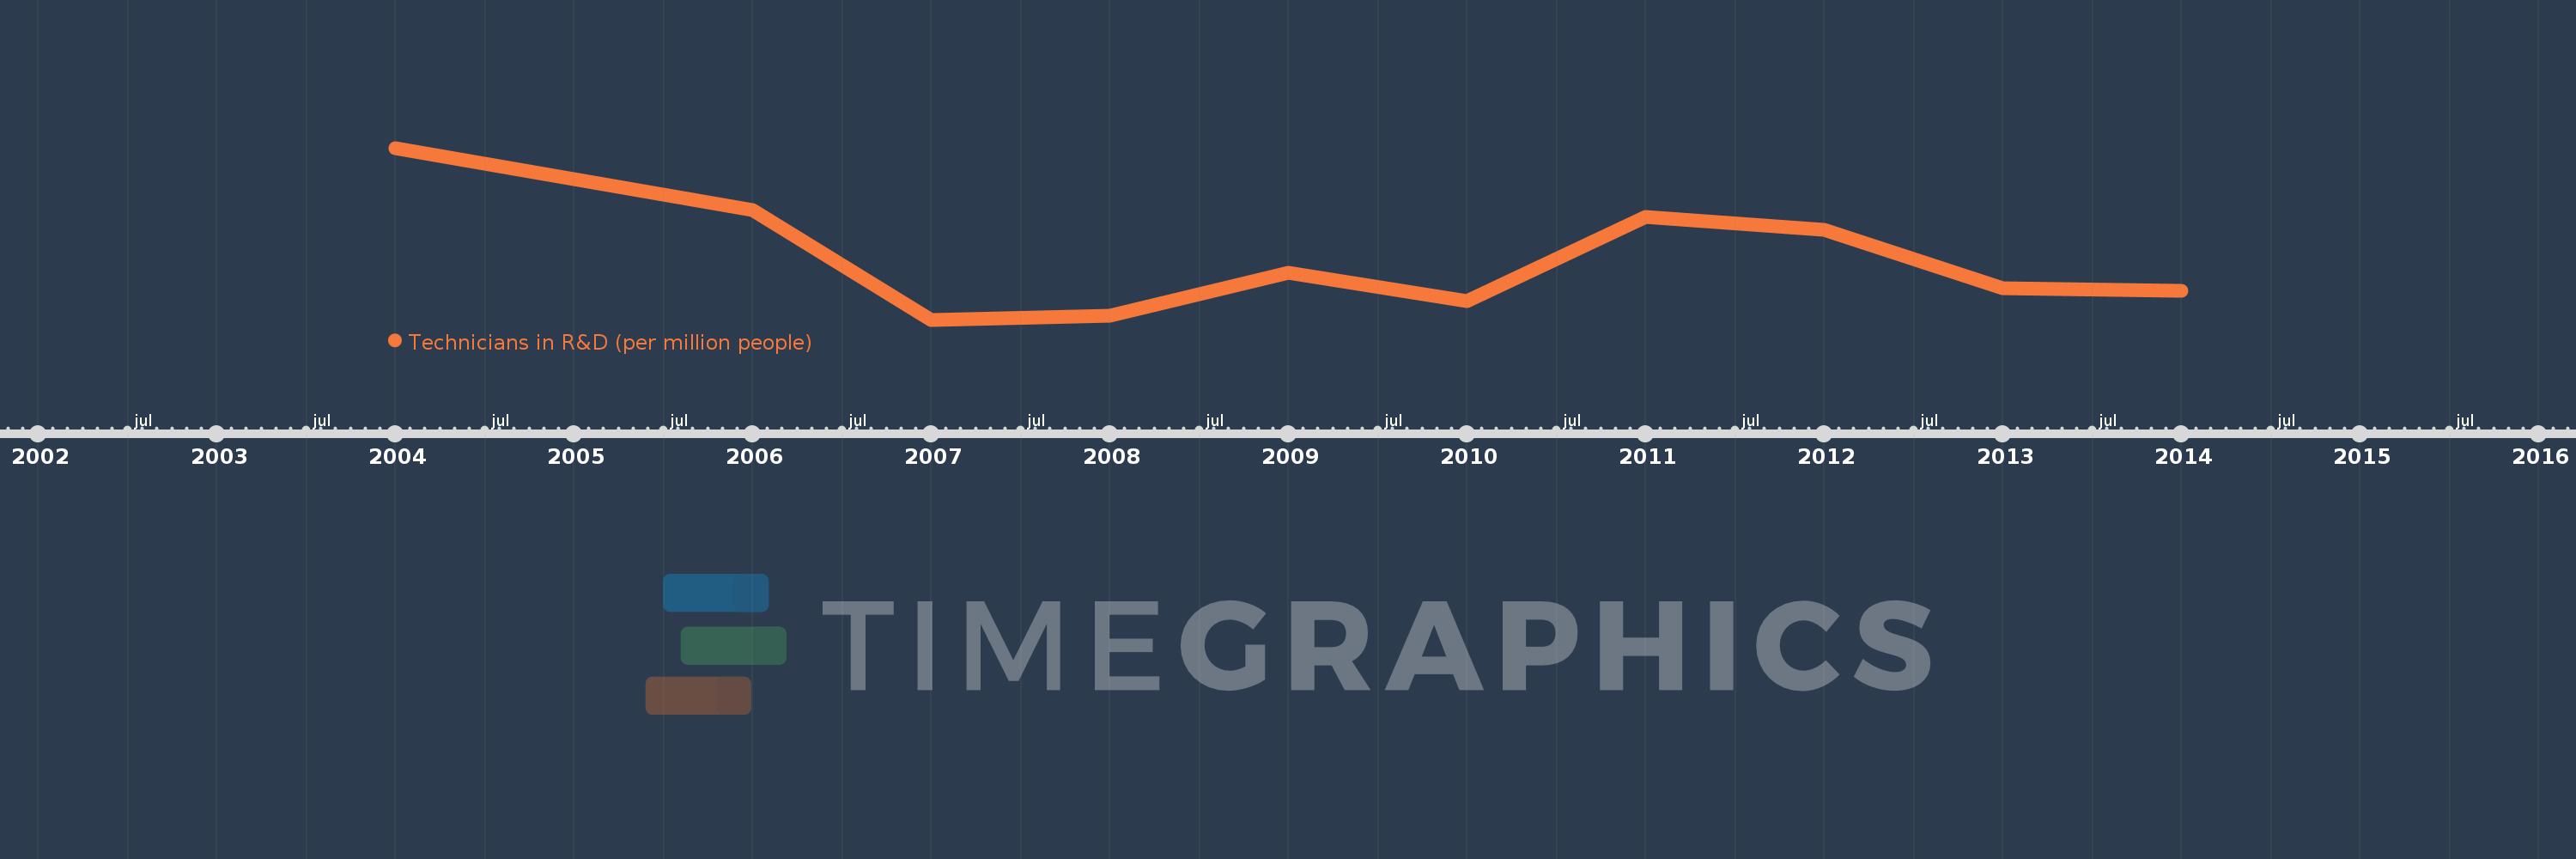
Questa scala temporale mostra un grafico dal 2004 anno al 2014 anno. Luxembourg. I dati fino ad 2003 anno non disponibili. Il numero di osservazioni attuali secondo i date: 10.
La fonte (nome):
Indicatori dello sviluppo mondiale
La fonte (organizzazione):
United Nations Educational, Scientific, and Cultural Organization (UNESCO) Institute for Statistics.
Categorie:
Science & Technology
sono stati aggiornati
23 apr 2017 anni
Indicatori delle variazioni dei valori per anni
Minima:
2.759 Mille.
1 gen 2007 anni
Massimo:
3.767 Mille.
1 gen 2004 anni
Alla data di osservazione
Valore
Variazione assoluta
La variazione rispetto al valore precedente
1 gen 2004 anni
3.767 Mille.
+3.767 Mille.
0.0%
1 gen 2006 anni
3.402 Mille.
-364.423
-9.67%
1 gen 2007 anni
2.759 Mille.
-643.536
-18.91%
1 gen 2008 anni
2.783 Mille.
+24.291
0.88%
1 gen 2009 anni
3.037 Mille.
+253.623
9.11%
1 gen 2010 anni
2.868 Mille.
-168.553
-5.55%
1 gen 2011 anni
3.363 Mille.
+494.526
17.24%
1 gen 2012 anni
3.285 Mille.
-77.726
-2.31%
1 gen 2013 anni
2.945 Mille.
-339.792
-10.34%
1 gen 2014 anni
2.929 Mille.
-16.589
-0.56%
Classificazione dei paesi secondo i statistiche attuali per anni