Questa scala temporale mostra un grafico dal 1997 anno al 2015 anno. Poland. I dati fino ad 1996 anno non disponibili. Il numero di osservazioni attuali secondo i date: 19.
La fonte (nome):
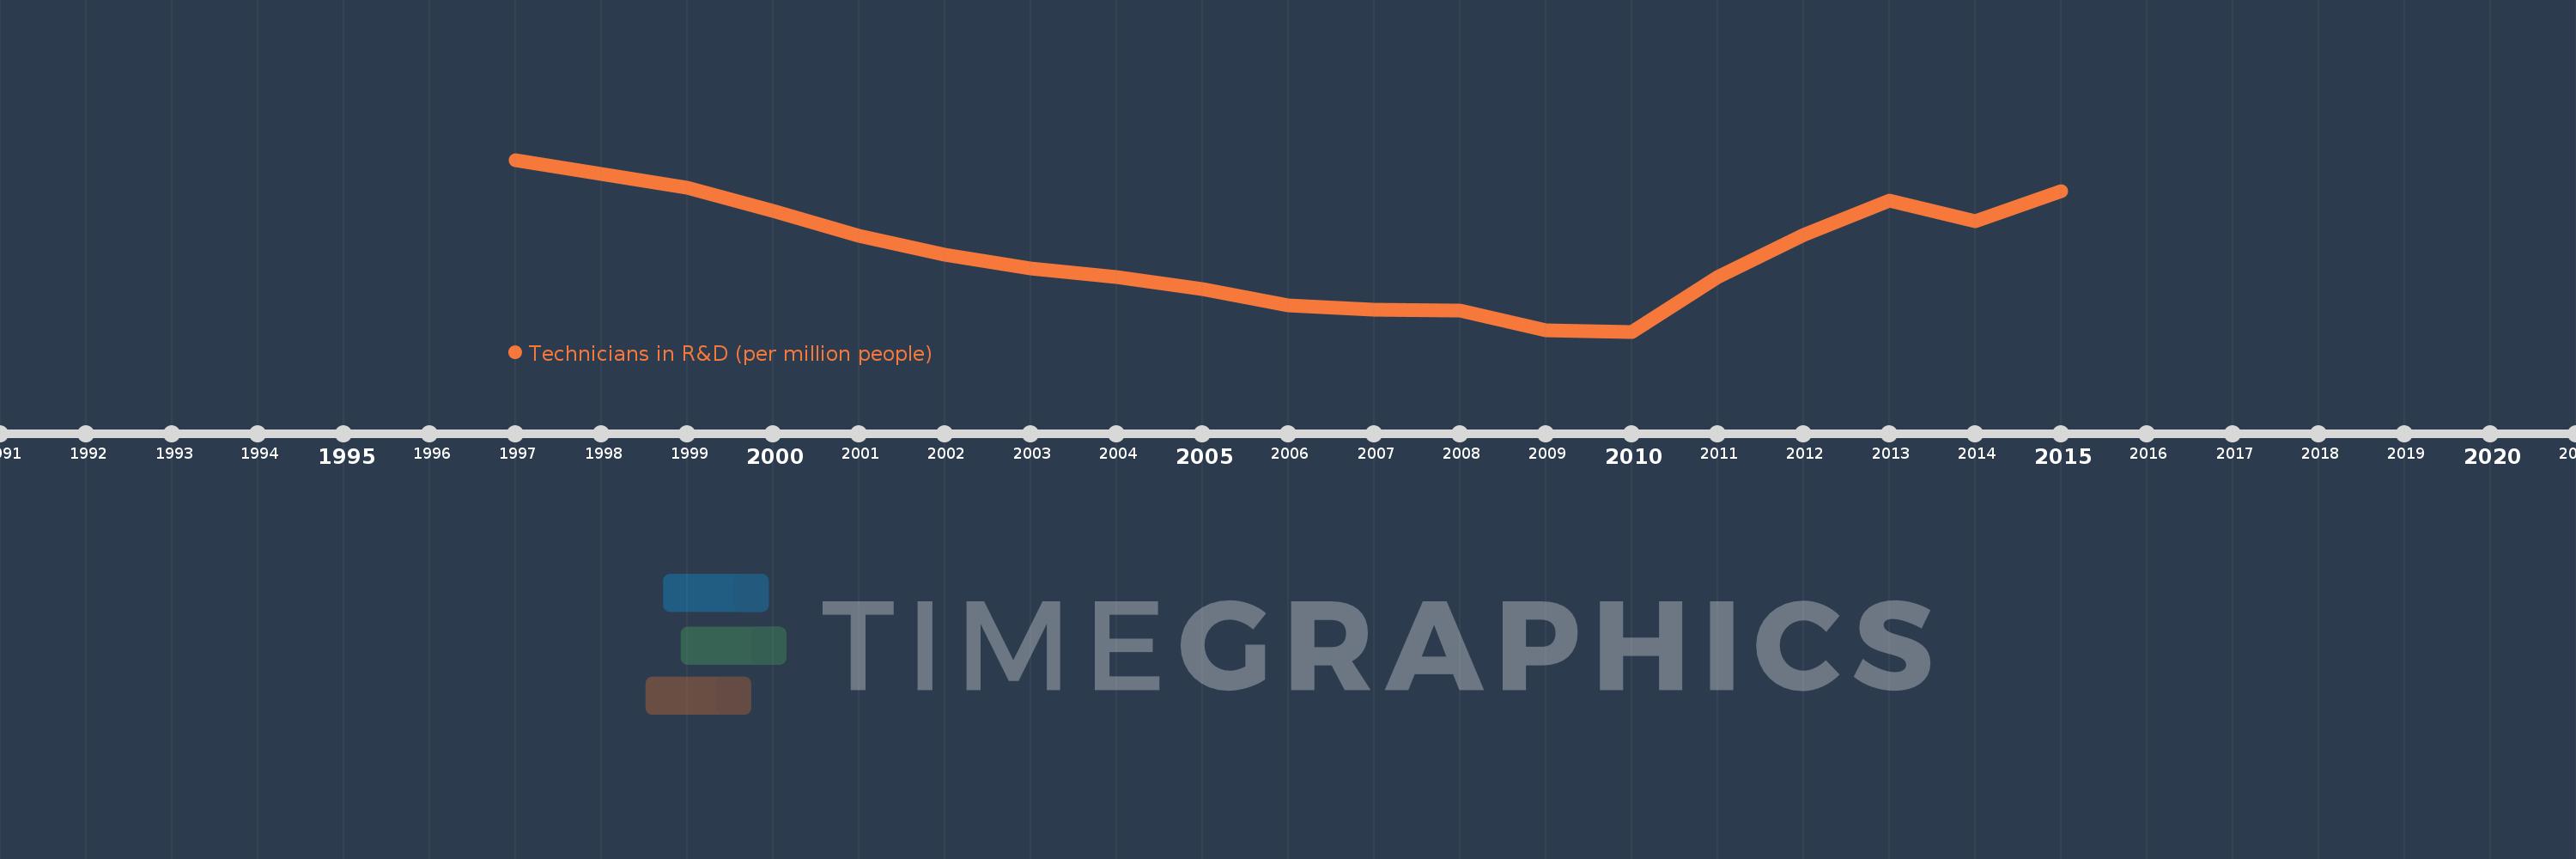
Indicatori dello sviluppo mondiale
La fonte (organizzazione):
United Nations Educational, Scientific, and Cultural Organization (UNESCO) Institute for Statistics.
Categorie:
Science & Technology
sono stati aggiornati
23 apr 2017 anni
Indicatori delle variazioni dei valori per anni
In media:
328.194
Minima:
187.502
1 gen 2010 anni
Massimo:
487.981
1 gen 1997 anni
Alla data di osservazione
Valore
Variazione assoluta
La variazione rispetto al valore precedente
1 gen 1997 anni
487.981
+487.981
0.0%
1 gen 1998 anni
463.804
-24.177
-4.95%
1 gen 1999 anni
439.395
-24.409
-5.26%
1 gen 2000 anni
398.854
-40.541
-9.23%
1 gen 2001 anni
354.62
-44.234
-11.09%
1 gen 2002 anni
321.422
-33.197
-9.36%
1 gen 2003 anni
297.362
-24.06
-7.49%
1 gen 2004 anni
282.982
-14.38
-4.84%
1 gen 2005 anni
261.192
-21.79
-7.7%
1 gen 2006 anni
232.61
-28.582
-10.94%
1 gen 2007 anni
225.101
-7.509
-3.23%
1 gen 2008 anni
224.177
-0.924
-0.41%
1 gen 2009 anni
189.221
-34.956
-15.59%
1 gen 2010 anni
187.502
-1.719
-0.91%
1 gen 2011 anni
283.569
+96.067
51.24%
1 gen 2012 anni
356.906
+73.336
25.86%
1 gen 2013 anni
416.398
+59.492
16.67%
1 gen 2014 anni
380.078
-36.32
-8.72%
1 gen 2015 anni
432.507
+52.429
13.79%
Classificazione dei paesi secondo i statistiche attuali per anni