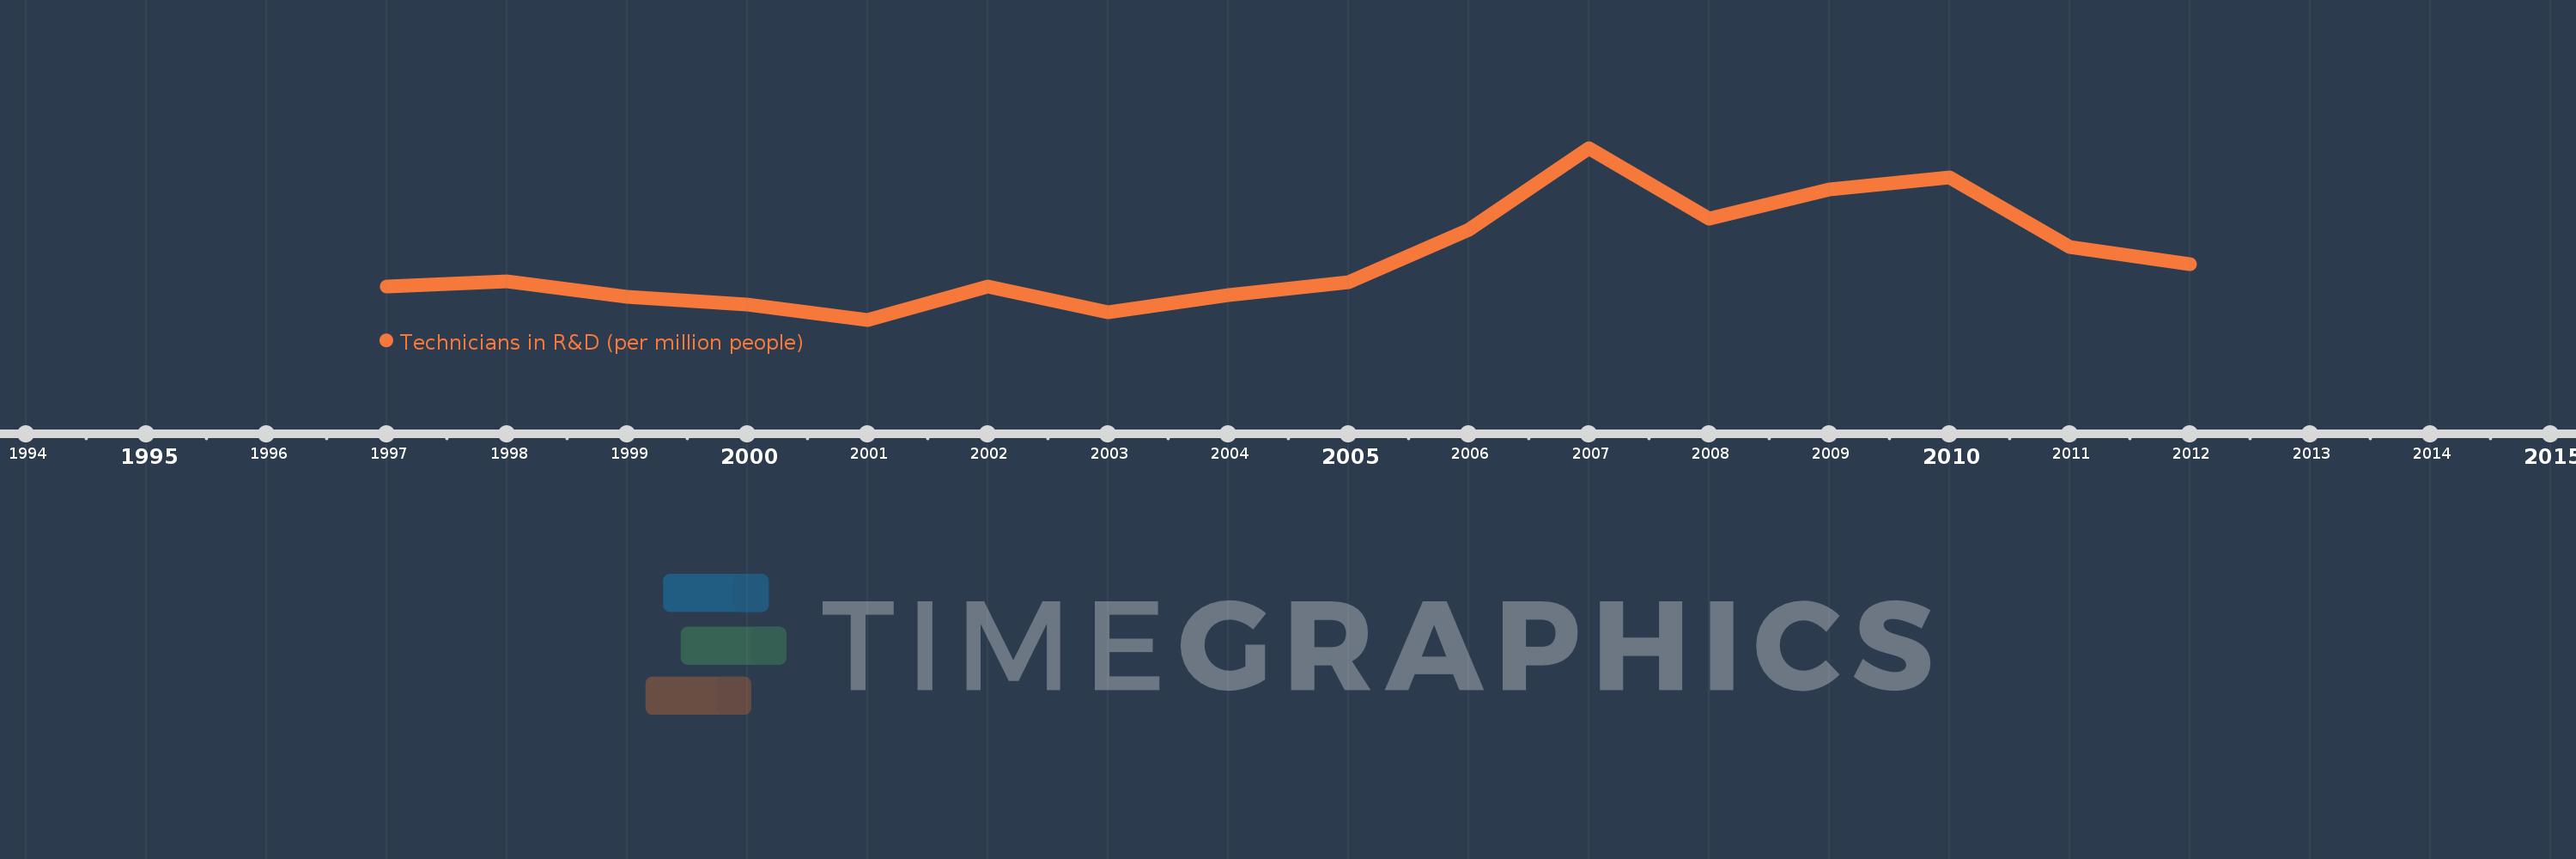
Questa scala temporale mostra un grafico dal 1997 anno al 2012 anno. Latvia. I dati fino ad 1996 anno non disponibili. Il numero di osservazioni attuali secondo i date: 16.
La fonte (nome):
Indicatori dello sviluppo mondiale
La fonte (organizzazione):
United Nations Educational, Scientific, and Cultural Organization (UNESCO) Institute for Statistics.
Categorie:
Science & Technology
sono stati aggiornati
23 apr 2017 anni
Indicatori delle variazioni dei valori per anni
In media:
410.094
Minima:
267.765
1 gen 2001 anni
Massimo:
667.999
1 gen 2007 anni
Alla data di osservazione
Valore
Variazione assoluta
La variazione rispetto al valore precedente
1 gen 1997 anni
345.767
+345.767
0.0%
1 gen 1998 anni
358.166
+12.399
3.59%
1 gen 1999 anni
321.786
-36.38
-10.16%
1 gen 2000 anni
303.192
-18.594
-5.78%
1 gen 2001 anni
267.765
-35.427
-11.68%
1 gen 2002 anni
344.968
+77.203
28.83%
1 gen 2003 anni
284.884
-60.084
-17.42%
1 gen 2004 anni
324.45
+39.566
13.89%
1 gen 2005 anni
355.349
+30.899
9.52%
1 gen 2006 anni
476.755
+121.406
34.17%
1 gen 2007 anni
667.999
+191.244
40.11%
1 gen 2008 anni
504.288
-163.711
-24.51%
1 gen 2009 anni
572.237
+67.949
13.47%
1 gen 2010 anni
599.346
+27.109
4.74%
1 gen 2011 anni
437.69
-161.656
-26.97%
1 gen 2012 anni
396.868
-40.823
-9.33%
Classificazione dei paesi secondo i statistiche attuali per anni