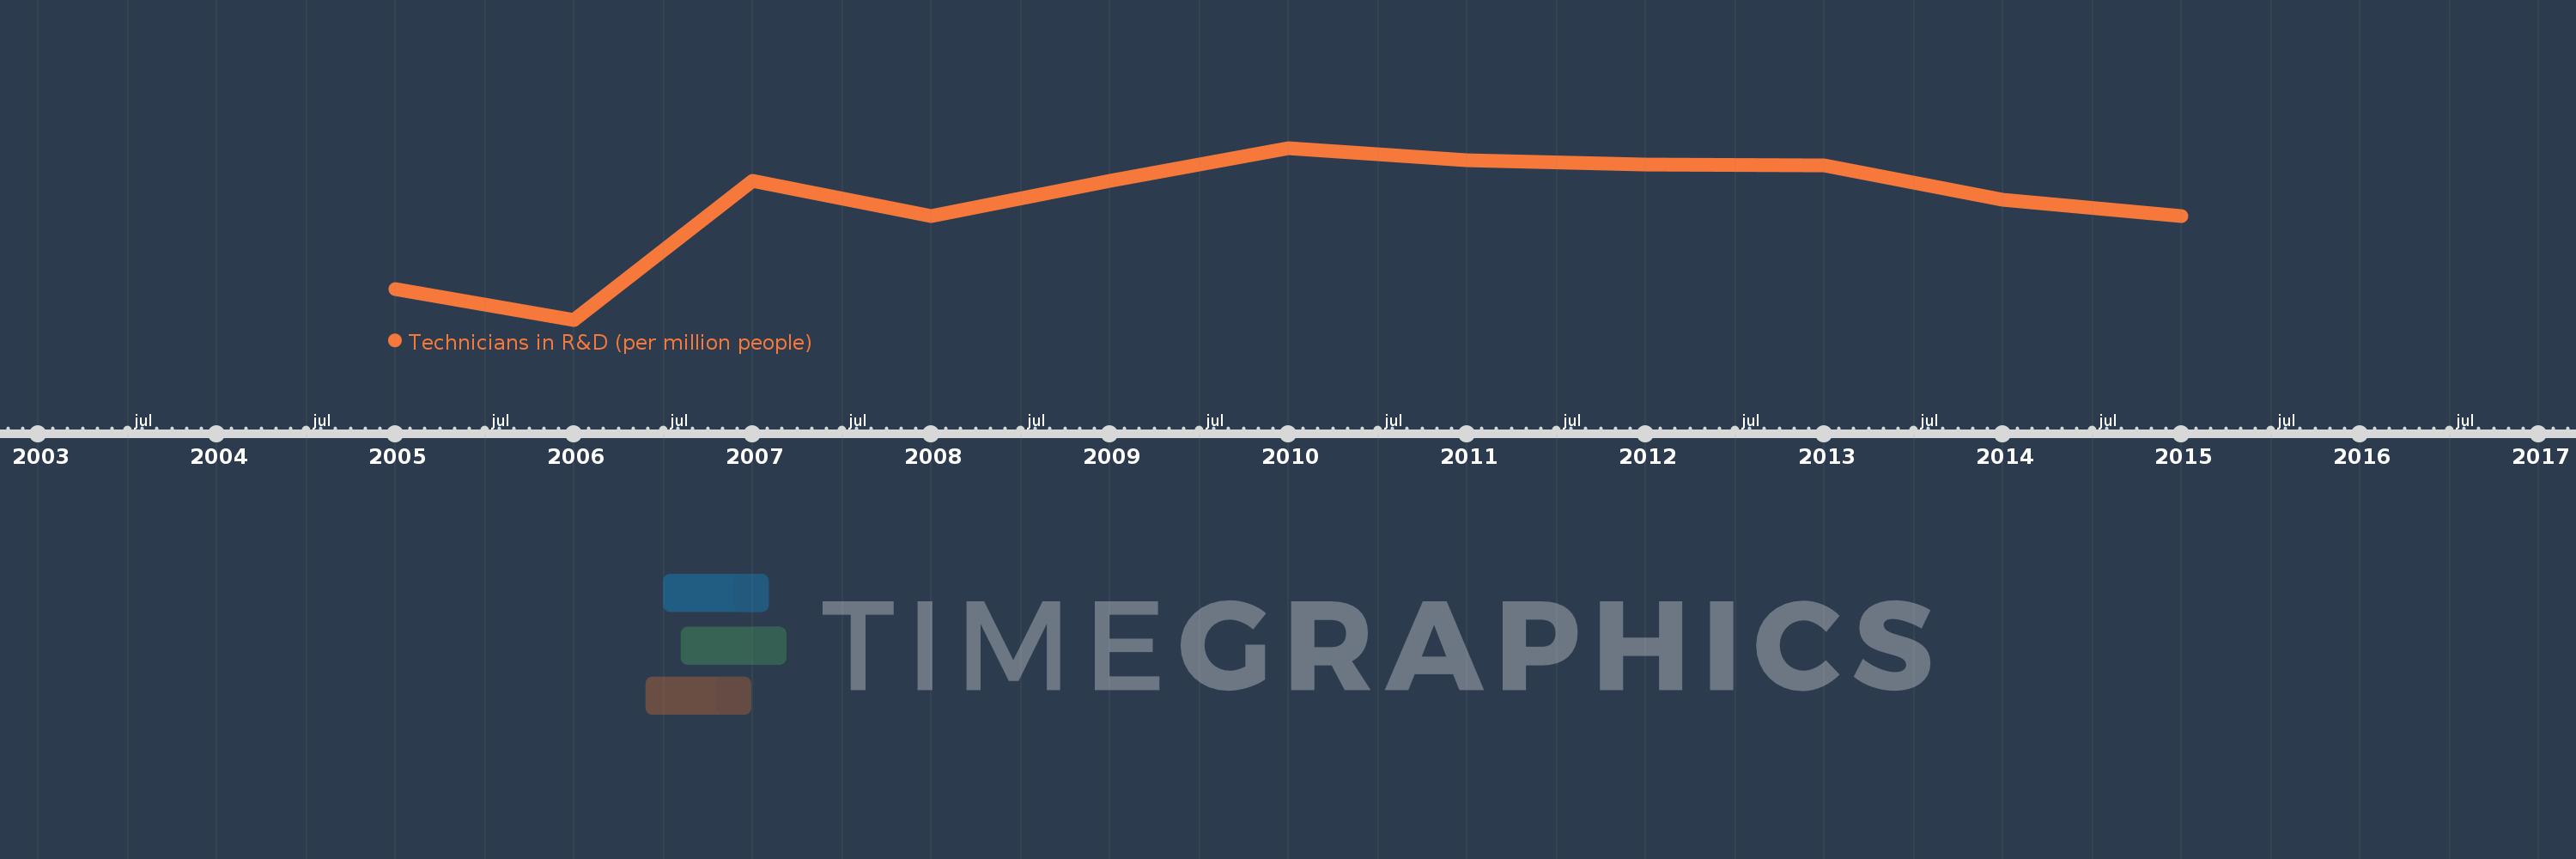
Questa scala temporale mostra un grafico dal 2005 anno al 2015 anno. France. I dati fino ad 2004 anno non disponibili. Il numero di osservazioni attuali secondo i date: 11.
La fonte (nome):
Indicatori dello sviluppo mondiale
La fonte (organizzazione):
United Nations Educational, Scientific, and Cultural Organization (UNESCO) Institute for Statistics.
Categorie:
Science & Technology
sono stati aggiornati
23 apr 2017 anni
Indicatori delle variazioni dei valori per anni
In media:
1.835 Mille.
Minima:
1.717 Mille.
1 gen 2006 anni
Massimo:
1.892 Mille.
1 gen 2010 anni
Alla data di osservazione
Valore
Variazione assoluta
La variazione rispetto al valore precedente
1 gen 2005 anni
1.749 Mille.
+1.749 Mille.
0.0%
1 gen 2006 anni
1.717 Mille.
-31.247
-1.79%
1 gen 2007 anni
1.859 Mille.
+141.55
8.24%
1 gen 2008 anni
1.823 Mille.
-35.865
-1.93%
1 gen 2009 anni
1.859 Mille.
+35.64
1.96%
1 gen 2010 anni
1.892 Mille.
+33.398
1.8%
1 gen 2011 anni
1.88 Mille.
-12.094
-0.64%
1 gen 2012 anni
1.875 Mille.
-4.907
-0.26%
1 gen 2013 anni
1.874 Mille.
-0.737
-0.04%
1 gen 2014 anni
1.839 Mille.
-35.084
-1.87%
1 gen 2015 anni
1.822 Mille.
-16.799
-0.91%
Classificazione dei paesi secondo i statistiche attuali per anni