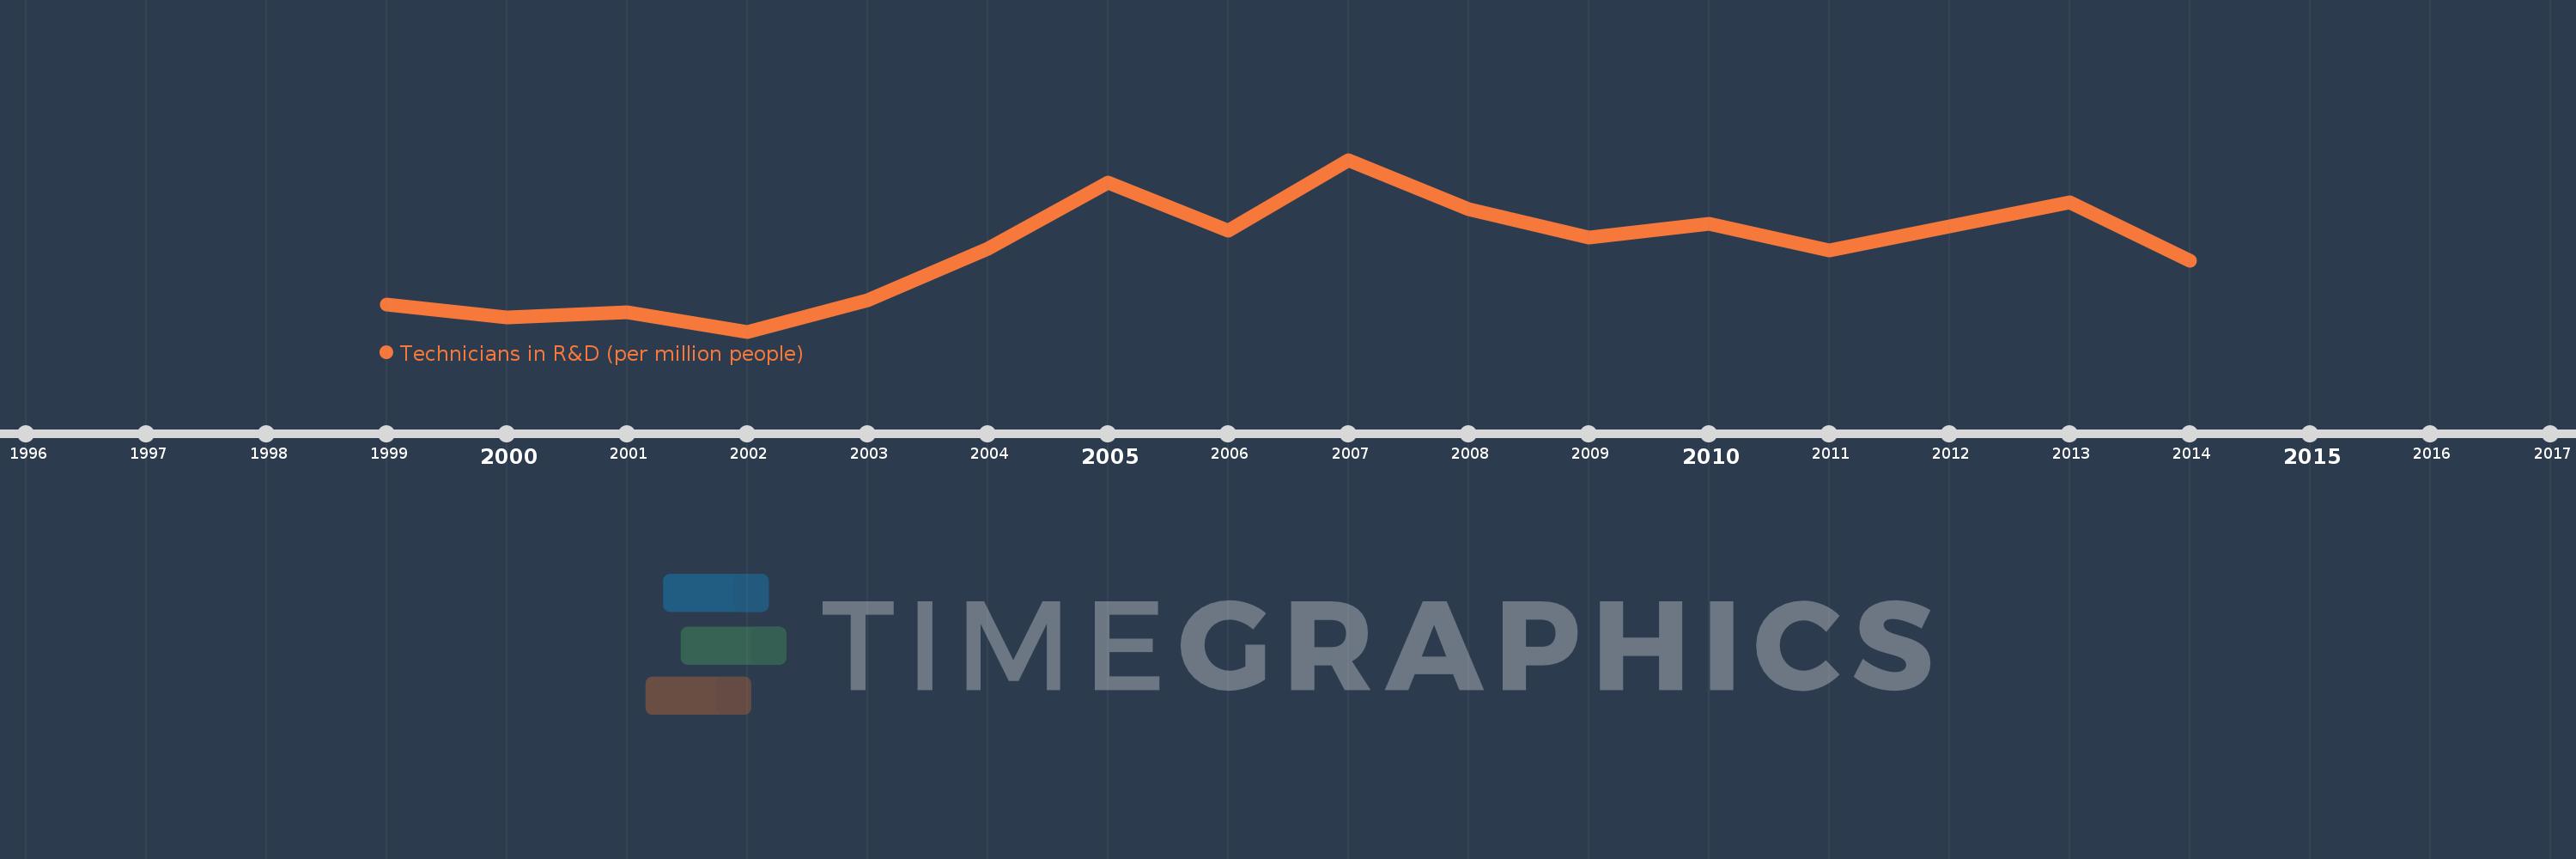
Questa scala temporale mostra un grafico dal 1999 anno al 2014 anno. Hong Kong SAR, China. I dati fino ad 1998 anno non disponibili. Il numero di osservazioni attuali secondo i date: 16.
La fonte (nome):
Indicatori dello sviluppo mondiale
La fonte (organizzazione):
United Nations Educational, Scientific, and Cultural Organization (UNESCO) Institute for Statistics.
Categorie:
Science & Technology
sono stati aggiornati
23 apr 2017 anni
Indicatori delle variazioni dei valori per anni
In media:
309.564
Minima:
169.969
1 gen 2002 anni
Massimo:
463.256
1 gen 2007 anni
Alla data di osservazione
Valore
Variazione assoluta
La variazione rispetto al valore precedente
1 gen 1999 anni
216.17
+216.17
0.0%
1 gen 2000 anni
194.644
-21.526
-9.96%
1 gen 2001 anni
202.55
+7.906
4.06%
1 gen 2002 anni
169.969
-32.581
-16.09%
1 gen 2003 anni
223.494
+53.525
31.49%
1 gen 2004 anni
312.1
+88.606
39.65%
1 gen 2005 anni
424.456
+112.355
36.0%
1 gen 2006 anni
342.859
-81.597
-19.22%
1 gen 2007 anni
463.256
+120.397
35.12%
1 gen 2008 anni
378.422
-84.834
-18.31%
1 gen 2009 anni
330.807
-47.615
-12.58%
1 gen 2010 anni
354.425
+23.619
7.14%
1 gen 2011 anni
308.712
-45.713
-12.9%
1 gen 2012 anni
349.507
+40.795
13.21%
1 gen 2013 anni
391.306
+41.799
11.96%
1 gen 2014 anni
290.343
-100.963
-25.8%
Classificazione dei paesi secondo i statistiche attuali per anni