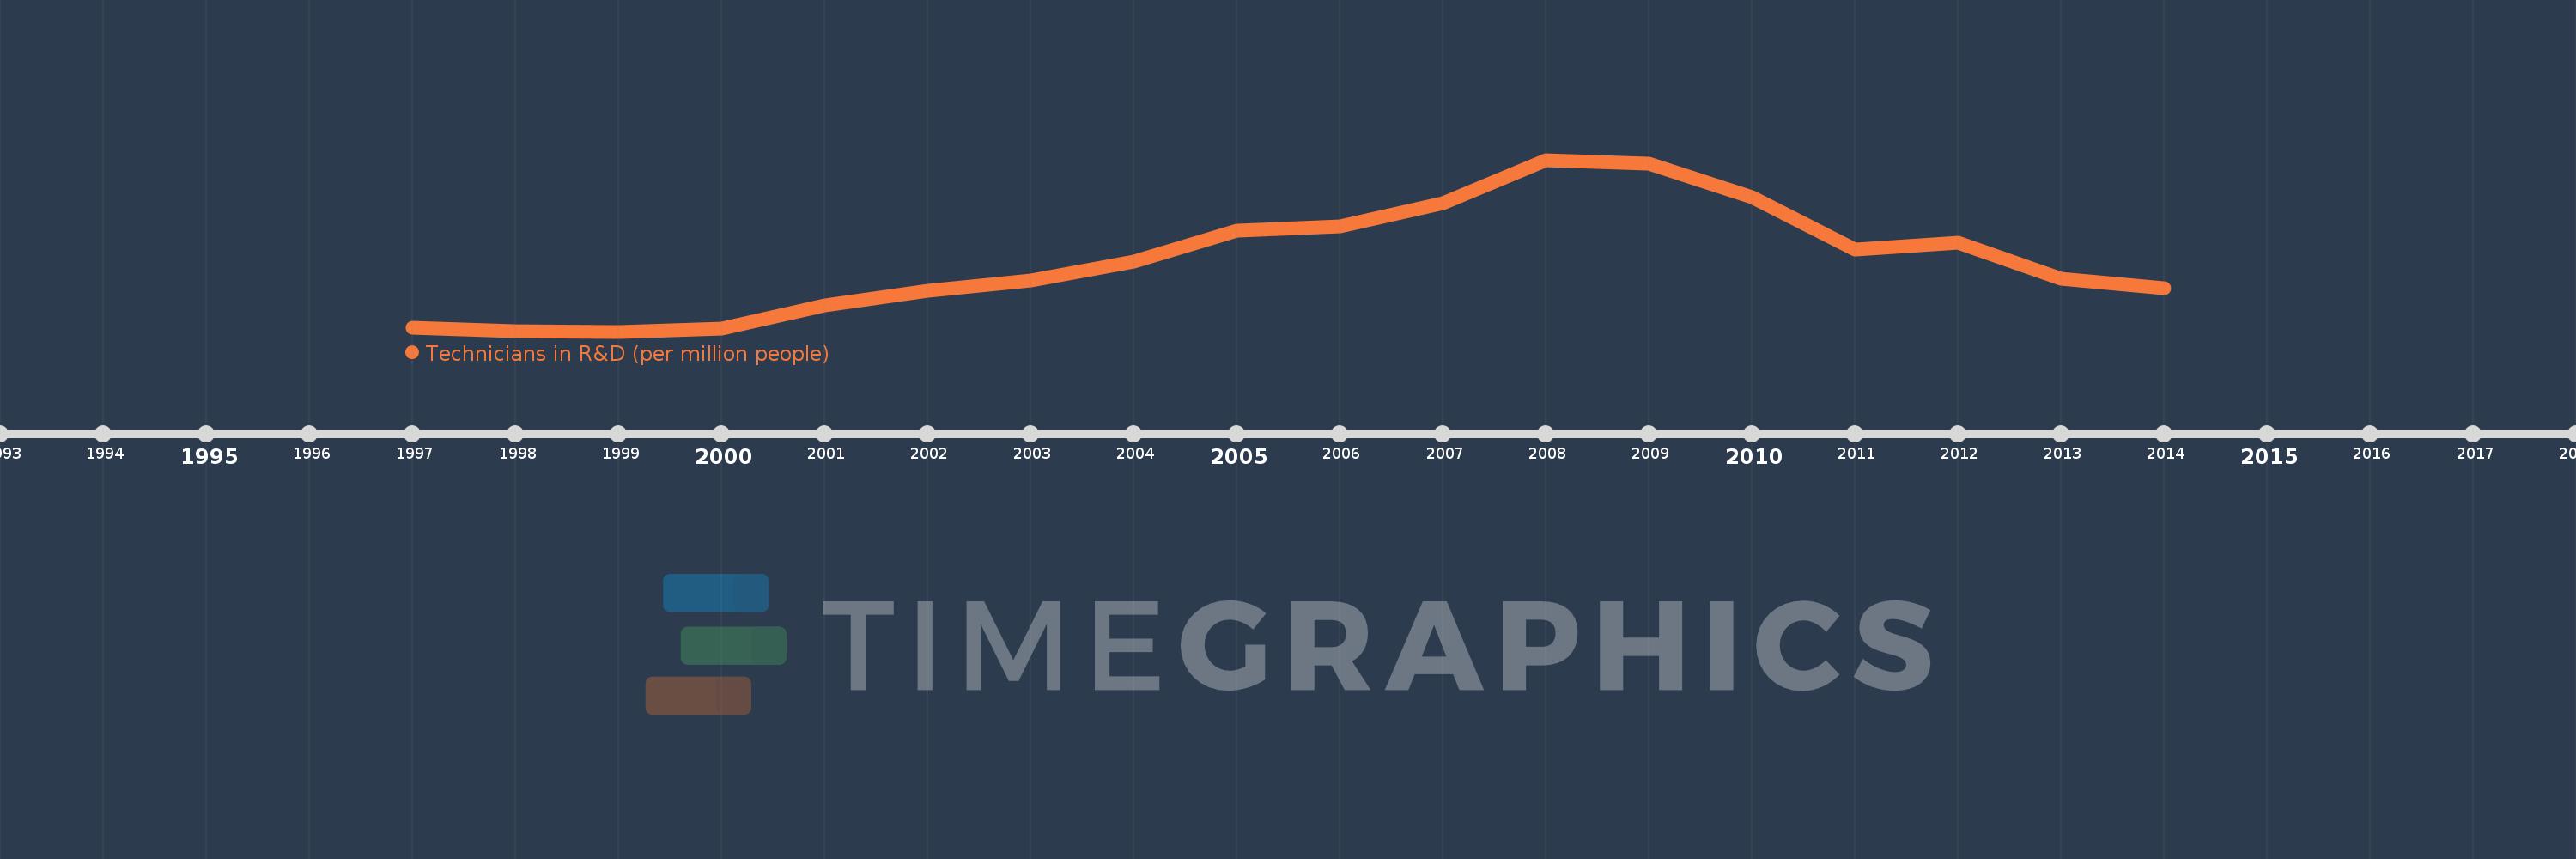
Questa scala temporale mostra un grafico dal 1997 anno al 2014 anno. Canada. I dati fino ad 1996 anno non disponibili. Il numero di osservazioni attuali secondo i date: 18.
La fonte (nome):
Indicatori dello sviluppo mondiale
La fonte (organizzazione):
United Nations Educational, Scientific, and Cultural Organization (UNESCO) Institute for Statistics.
Categorie:
Science & Technology
sono stati aggiornati
23 apr 2017 anni
Indicatori delle variazioni dei valori per anni
In media:
1.462 Mille.
Minima:
1.1 Mille.
1 gen 1999 anni
Massimo:
1.98 Mille.
1 gen 2008 anni
Alla data di osservazione
Valore
Variazione assoluta
La variazione rispetto al valore precedente
1 gen 1997 anni
1.122 Mille.
+1.122 Mille.
0.0%
1 gen 1998 anni
1.103 Mille.
-18.891
-1.68%
1 gen 1999 anni
1.1 Mille.
-2.929
-0.27%
1 gen 2000 anni
1.114 Mille.
+14.312
1.3%
1 gen 2001 anni
1.236 Mille.
+121.623
10.91%
1 gen 2002 anni
1.308 Mille.
+72.027
5.83%
1 gen 2003 anni
1.363 Mille.
+54.691
4.18%
1 gen 2004 anni
1.458 Mille.
+95.271
6.99%
1 gen 2005 anni
1.617 Mille.
+158.545
10.87%
1 gen 2006 anni
1.638 Mille.
+21.05
1.3%
1 gen 2007 anni
1.757 Mille.
+119.39
7.29%
1 gen 2008 anni
1.98 Mille.
+222.496
12.66%
1 gen 2009 anni
1.959 Mille.
-20.806
-1.05%
1 gen 2010 anni
1.789 Mille.
-169.522
-8.65%
1 gen 2011 anni
1.522 Mille.
-267.514
-14.95%
1 gen 2012 anni
1.557 Mille.
+35.11
2.31%
1 gen 2013 anni
1.372 Mille.
-184.79
-11.87%
1 gen 2014 anni
1.321 Mille.
-51.016
-3.72%
Classificazione dei paesi secondo i statistiche attuali per anni