Questa scala temporale mostra un grafico dal 1997 anno al 2015 anno. Ireland. I dati fino ad 1996 anno non disponibili. Il numero di osservazioni attuali secondo i date: 19.
La fonte (nome):
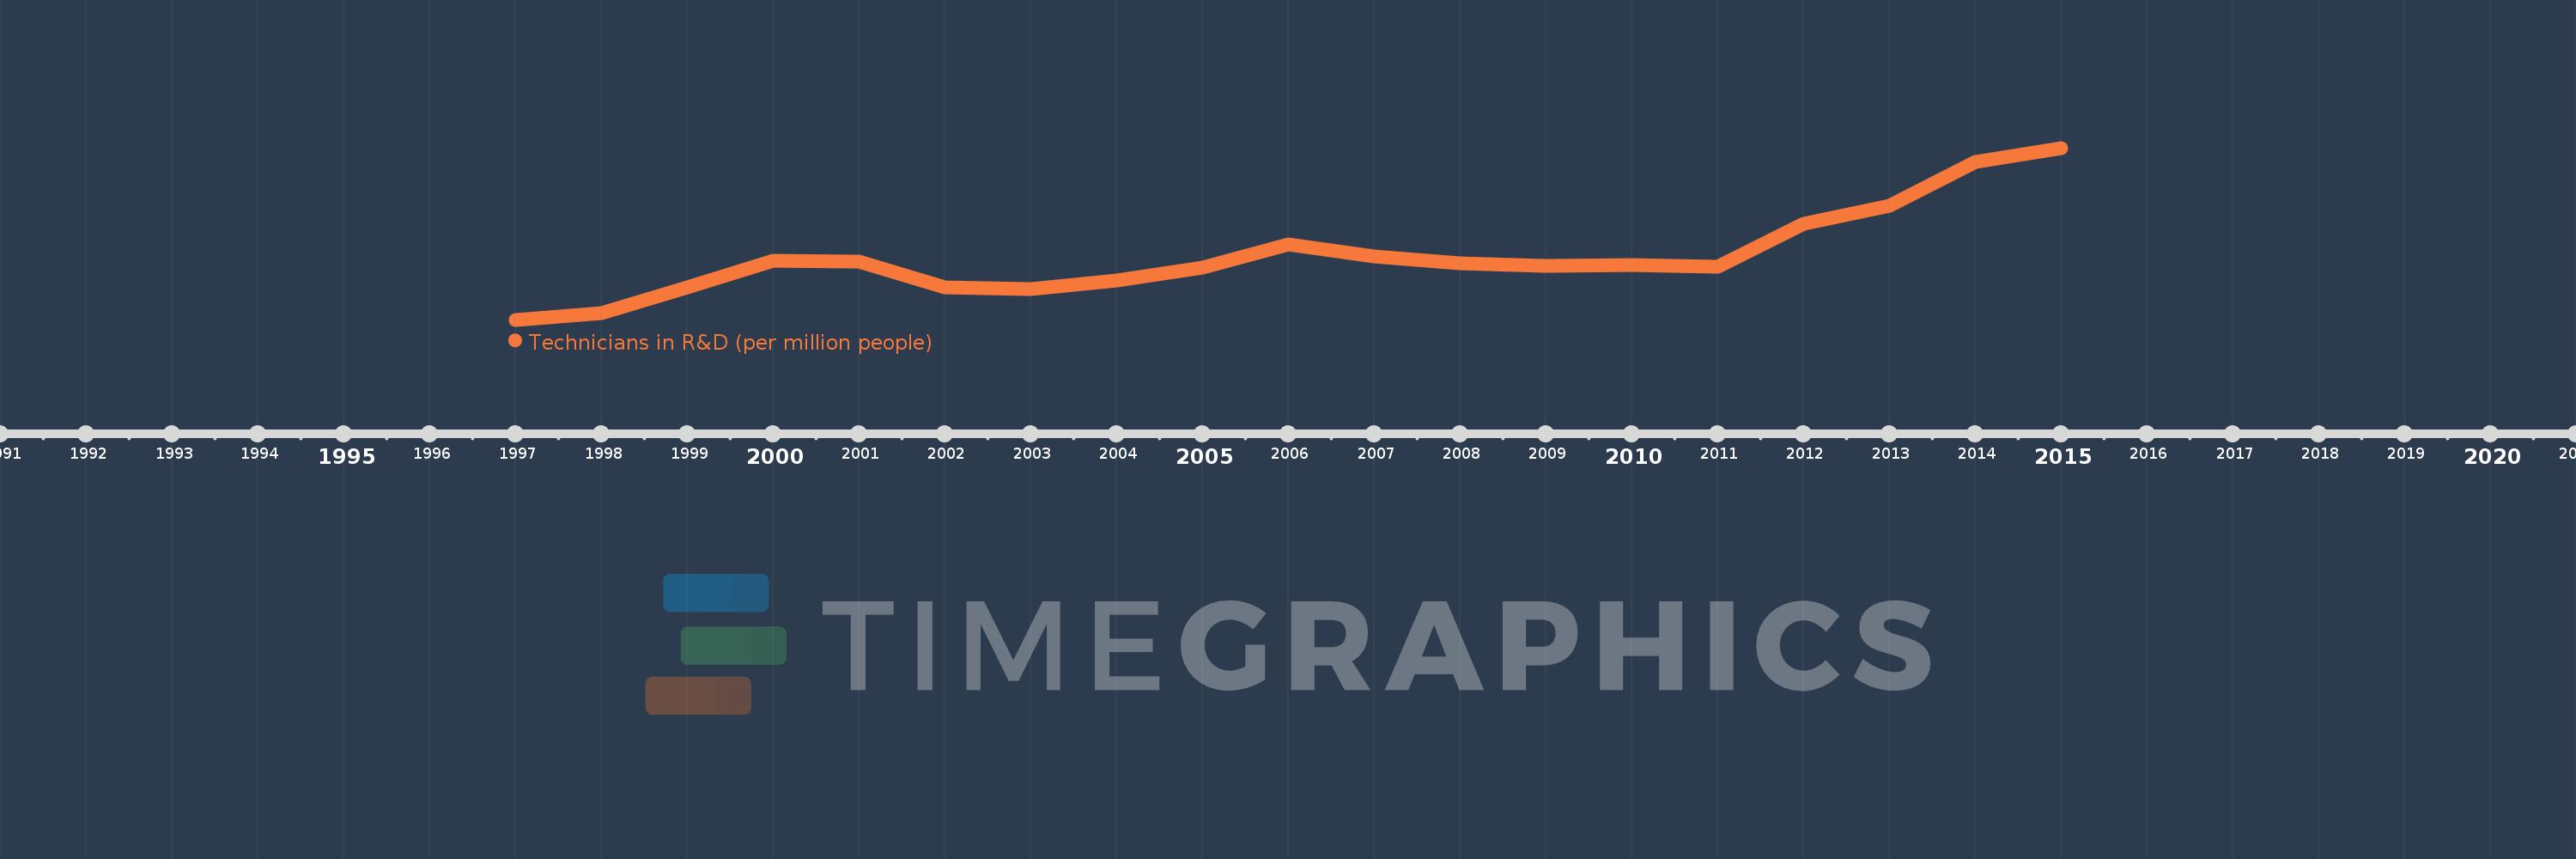
Indicatori dello sviluppo mondiale
La fonte (organizzazione):
United Nations Educational, Scientific, and Cultural Organization (UNESCO) Institute for Statistics.
Categorie:
Science & Technology
sono stati aggiornati
23 apr 2017 anni
Indicatori delle variazioni dei valori per anni
In media:
690.89
Minima:
509.466
1 gen 1997 anni
Massimo:
1.0 Mille.
1 gen 2015 anni
Alla data di osservazione
Valore
Variazione assoluta
La variazione rispetto al valore precedente
1 gen 1997 anni
509.466
+509.466
0.0%
1 gen 1998 anni
527.182
+17.716
3.48%
1 gen 1999 anni
602.027
+74.845
14.2%
1 gen 2000 anni
678.048
+76.021
12.63%
1 gen 2001 anni
676.285
-1.763
-0.26%
1 gen 2002 anni
601.535
-74.751
-11.05%
1 gen 2003 anni
596.994
-4.54
-0.75%
1 gen 2004 anni
621.383
+24.389
4.09%
1 gen 2005 anni
659.502
+38.119
6.13%
1 gen 2006 anni
723.886
+64.384
9.76%
1 gen 2007 anni
691.206
-32.68
-4.51%
1 gen 2008 anni
669.574
-21.632
-3.13%
1 gen 2009 anni
663.595
-5.979
-0.89%
1 gen 2010 anni
665.555
+1.96
0.3%
1 gen 2011 anni
660.987
-4.567
-0.69%
1 gen 2012 anni
783.521
+122.534
18.54%
1 gen 2013 anni
834.857
+51.335
6.55%
1 gen 2014 anni
961.132
+126.275
15.13%
1 gen 2015 anni
1.0 Mille.
+39.047
4.06%
Classificazione dei paesi secondo i statistiche attuali per anni