29
/fr/
fr
AIzaSyAYiBZKx7MnpbEhh9jyipgxe19OcubqV5w
April 1, 2024
87430
Bolivia
BOL
true
2
1
Investment in telecoms with private participation (current US$)
2015,2014,2011,2010,2009,2008,2007,2006,2005,2004,2003,2002,2001,2000,1999,1998,1997,1996,1992
Download
Bibliothèque de statistiques globales →Bolivia →

Investment in telecoms with private participation (current US$)

Cette statistique dans les autres pays:
AfghanistanAlbaniaAlgeriaAmerican SamoaAngolaAntigua and BarbudaArgentinaArmeniaAzerbaijanBangladeshBelarusBelizeBeninBhutanBoliviaBosnia and HerzegovinaBotswanaBrazilBulgariaBurkina FasoBurundiCabo VerdeCambodiaCameroonCentral African RepublicChadChileChinaColombiaCongo, Dem. Rep.Congo, Rep.Costa RicaCote d'IvoireCubaDominicaDominican RepublicEarly-demographic dividendEast Asia & Pacific (excluding high income)East Asia & Pacific (IDA & IBRD countries)EcuadorEgypt, Arab Rep.El SalvadorEritreaEthiopiaEurope & Central Asia (excluding high income)Europe & Central Asia (IDA & IBRD countries)FijiFragile and conflict affected situationsGabonGambia, TheGeorgiaGhanaGrenadaGuatemalaGuineaGuinea-BissauGuyanaHaitiHeavily indebted poor countries (HIPC)HondurasIBRD onlyIDA & IBRD totalIDA blendIDA onlyIDA totalIndiaIndonesiaIran, Islamic Rep.IraqJamaicaJordanKazakhstanKenyaKiribatiKorea, Dem. People’s Rep.KosovoKyrgyz RepublicLao PDRLate-demographic dividendLatin America & Caribbean Latin America & Caribbean (excluding high income)Latin America & the Caribbean (IDA & IBRD countries)Least developed countries: UN classificationLebanonLesothoLiberiaLithuaniaLow & middle incomeLow incomeLower middle incomeMacedonia, FYRMadagascarMalawiMalaysiaMaldivesMaliMauritaniaMauritiusMexicoMicronesia, Fed. Sts.Middle East & North Africa (excluding high income)Middle East & North Africa (IDA & IBRD countries)Middle incomeMoldovaMongoliaMontenegroMoroccoMozambiqueMyanmarNamibiaNepalNicaraguaNigerNigeriaOther small statesPacific island small statesPakistanPanamaPapua New GuineaParaguayPeruPhilippinesPre-demographic dividendRomaniaRussian FederationRwandaSamoaSenegalSerbiaSeychellesSierra LeoneSomaliaSouth AfricaSouth AsiaSouth Asia (IDA & IBRD)South SudanSri LankaSt. Kitts and NevisSt. LuciaSt. Vincent and the GrenadinesSub-Saharan Africa Sub-Saharan Africa (excluding high income)Sub-Saharan Africa (IDA & IBRD countries)SudanSurinameSwazilandSyrian Arab RepublicTajikistanTanzaniaThailandTimor-LesteTogoTongaTunisiaTurkeyTurkmenistanUgandaUkraineUpper middle incomeUruguayUzbekistanVanuatuVenezuela, RBVietnamWest Bank and GazaYemen, Rep.ZambiaZimbabwe
La ligne de temps
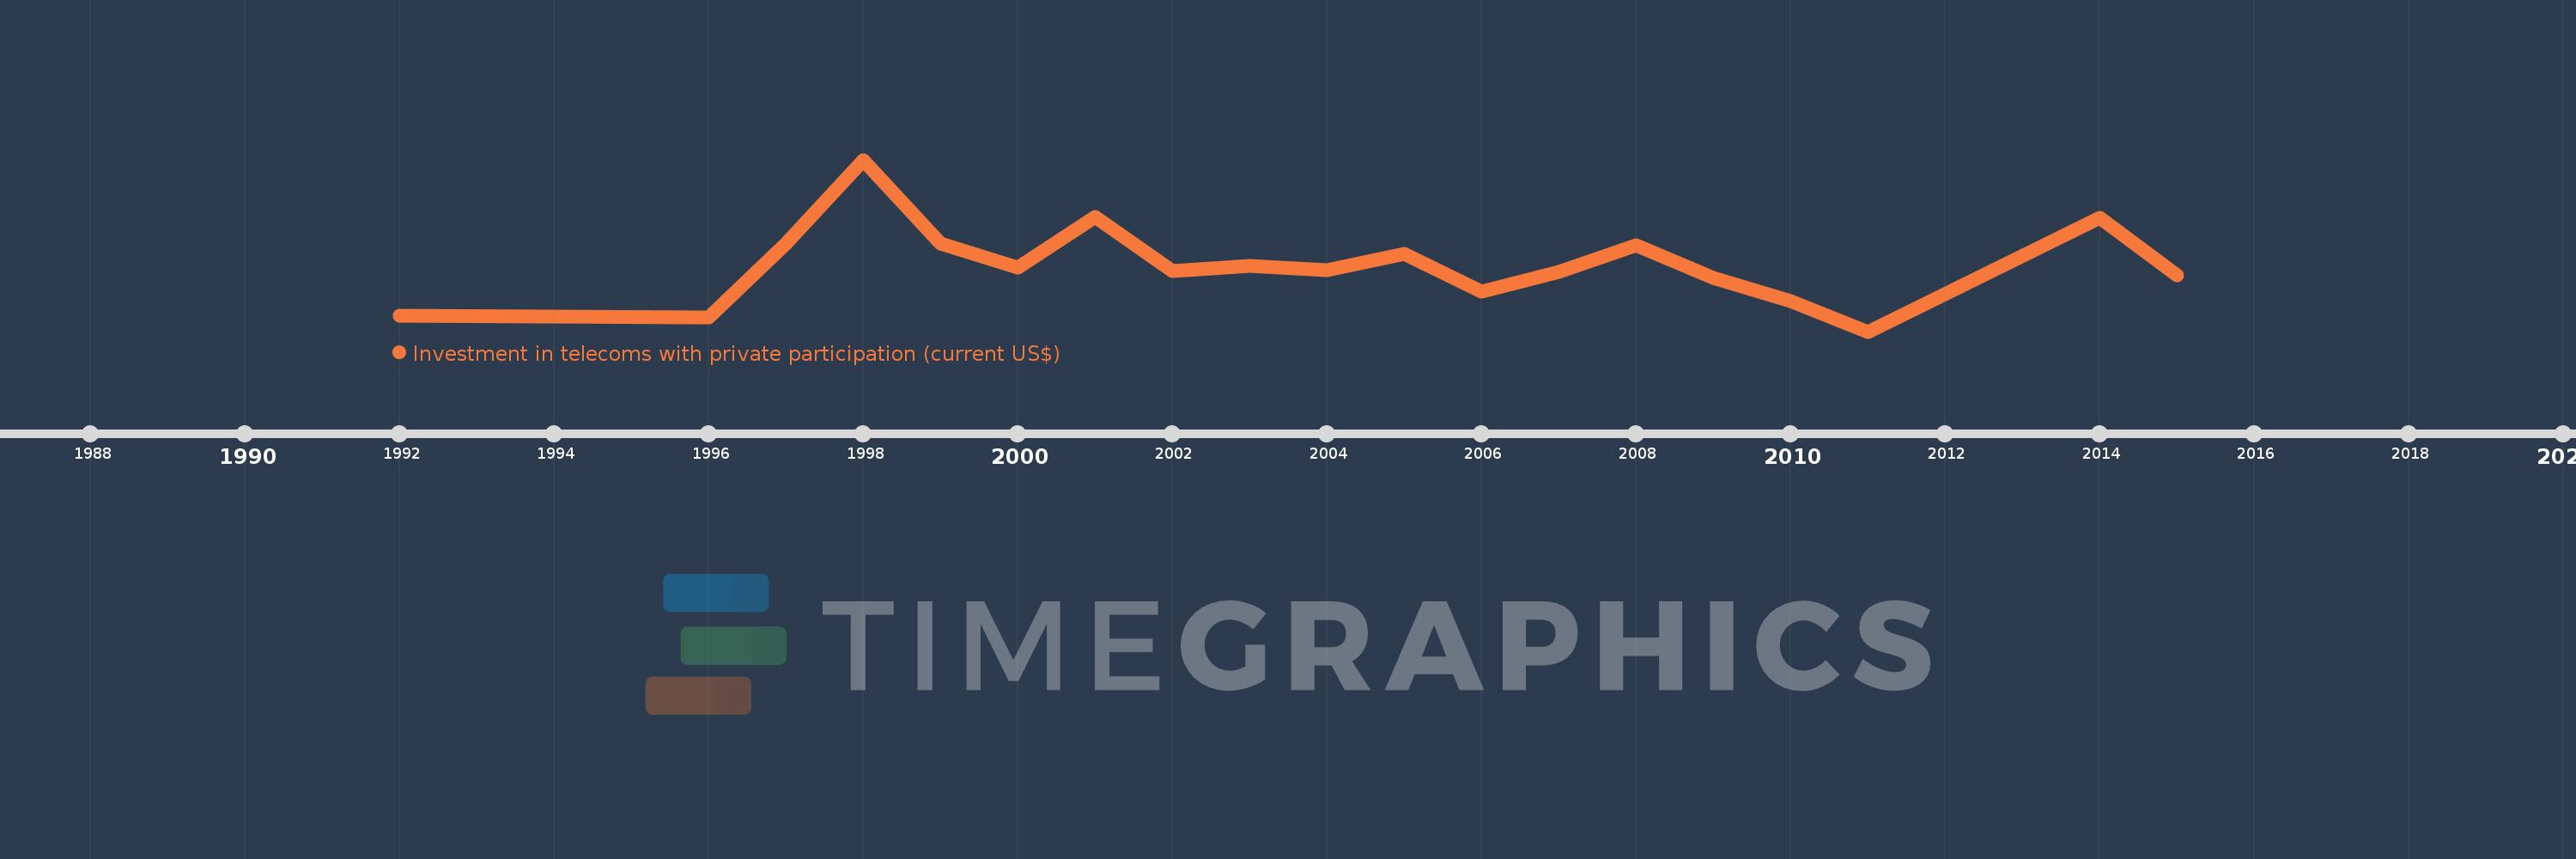
Cette échelle de temps montre un graphique de 1992 année à 2015 année Bolivia. Les données jusqu'à 1991 année ne sont pas présentés. Quantité d'observations actuelles selon dates: 19.
Source (désignation):
Les indicateurs du développement mondiale
Source (organisation):
World Bank, Private Participation in Infrastructure Project Database (http://ppi.worldbank.org).
Catégories:
Infrastructure, Private Sector
Dernière mise à jour
23 avr. 2017
Les indicateurs de changement de valeurs selon les années
En moyenne:
82.3 mln.
Minimum:
0.0
1 janv. 2011
Maximum:
213.0 mln.
1 janv. 1998
Pour la date d''observation
Valeur
Changement absolu
Le changement par rapport à la valeur précédente
1 janv. 1992
20.0 mln.
+20.0 mln.
0.0%
1 janv. 1996
18.0 mln.
-2.0 mln.
-10.0%
1 janv. 1997
109.0 mln.
+91.0 mln.
505.56%
1 janv. 1998
213.0 mln.
+104.0 mln.
95.41%
1 janv. 1999
109.0 mln.
-104.0 mln.
-48.83%
1 janv. 2000
79.0 mln.
-30.0 mln.
-27.52%
1 janv. 2001
142.4 mln.
+63.4 mln.
80.25%
1 janv. 2002
75.0 mln.
-67.4 mln.
-47.33%
1 janv. 2003
81.5 mln.
+6.5 mln.
8.67%
1 janv. 2004
75.8 mln.
-5.7 mln.
-6.99%
1 janv. 2005
96.8 mln.
+21.0 mln.
27.7%
1 janv. 2006
49.0 mln.
-47.8 mln.
-49.38%
1 janv. 2007
73.8 mln.
+24.8 mln.
50.61%
1 janv. 2008
107.2 mln.
+33.4 mln.
45.26%
1 janv. 2009
66.3 mln.
-40.9 mln.
-38.15%
1 janv. 2010
37.4 mln.
-28.9 mln.
-43.59%
1 janv. 2011
0.0
-37.4 mln.
-100.0%
1 janv. 2014
141.2 mln.
+141.2 mln.
%
1 janv. 2015
69.3 mln.
-71.9 mln.
-50.92%
Classement des pays selon les statistiques actuelles par années

Commentaires:

Envoyer
PremiumAbout & FeedbackUn accordConfidentialité
logo
© 2022 Selected Technologies LLC – Morgan Hill, California