29
/fr/
fr
AIzaSyAYiBZKx7MnpbEhh9jyipgxe19OcubqV5w
April 1, 2024
181270
Lithuania
LTU
true
2
1
Investment in telecoms with private participation (current US$)
2014,2013,2012,2011,2010,2009,2008,2007,2006,2005,2004,2003,2002,2001,2000,1999,1998,1997,1996,1993
Download
Bibliothèque de statistiques globales →Lithuania →

Investment in telecoms with private participation (current US$)

Cette statistique dans les autres pays:
AfghanistanAlbaniaAlgeriaAmerican SamoaAngolaAntigua and BarbudaArgentinaArmeniaAzerbaijanBangladeshBelarusBelizeBeninBhutanBoliviaBosnia and HerzegovinaBotswanaBrazilBulgariaBurkina FasoBurundiCabo VerdeCambodiaCameroonCentral African RepublicChadChileChinaColombiaCongo, Dem. Rep.Congo, Rep.Costa RicaCote d'IvoireCubaDominicaDominican RepublicEarly-demographic dividendEast Asia & Pacific (excluding high income)East Asia & Pacific (IDA & IBRD countries)EcuadorEgypt, Arab Rep.El SalvadorEritreaEthiopiaEurope & Central Asia (excluding high income)Europe & Central Asia (IDA & IBRD countries)FijiFragile and conflict affected situationsGabonGambia, TheGeorgiaGhanaGrenadaGuatemalaGuineaGuinea-BissauGuyanaHaitiHeavily indebted poor countries (HIPC)HondurasIBRD onlyIDA & IBRD totalIDA blendIDA onlyIDA totalIndiaIndonesiaIran, Islamic Rep.IraqJamaicaJordanKazakhstanKenyaKiribatiKorea, Dem. People’s Rep.KosovoKyrgyz RepublicLao PDRLate-demographic dividendLatin America & Caribbean Latin America & Caribbean (excluding high income)Latin America & the Caribbean (IDA & IBRD countries)Least developed countries: UN classificationLebanonLesothoLiberiaLithuaniaLow & middle incomeLow incomeLower middle incomeMacedonia, FYRMadagascarMalawiMalaysiaMaldivesMaliMauritaniaMauritiusMexicoMicronesia, Fed. Sts.Middle East & North Africa (excluding high income)Middle East & North Africa (IDA & IBRD countries)Middle incomeMoldovaMongoliaMontenegroMoroccoMozambiqueMyanmarNamibiaNepalNicaraguaNigerNigeriaOther small statesPacific island small statesPakistanPanamaPapua New GuineaParaguayPeruPhilippinesPre-demographic dividendRomaniaRussian FederationRwandaSamoaSenegalSerbiaSeychellesSierra LeoneSomaliaSouth AfricaSouth AsiaSouth Asia (IDA & IBRD)South SudanSri LankaSt. Kitts and NevisSt. LuciaSt. Vincent and the GrenadinesSub-Saharan Africa Sub-Saharan Africa (excluding high income)Sub-Saharan Africa (IDA & IBRD countries)SudanSurinameSwazilandSyrian Arab RepublicTajikistanTanzaniaThailandTimor-LesteTogoTongaTunisiaTurkeyTurkmenistanUgandaUkraineUpper middle incomeUruguayUzbekistanVanuatuVenezuela, RBVietnamWest Bank and GazaYemen, Rep.ZambiaZimbabwe
La ligne de temps
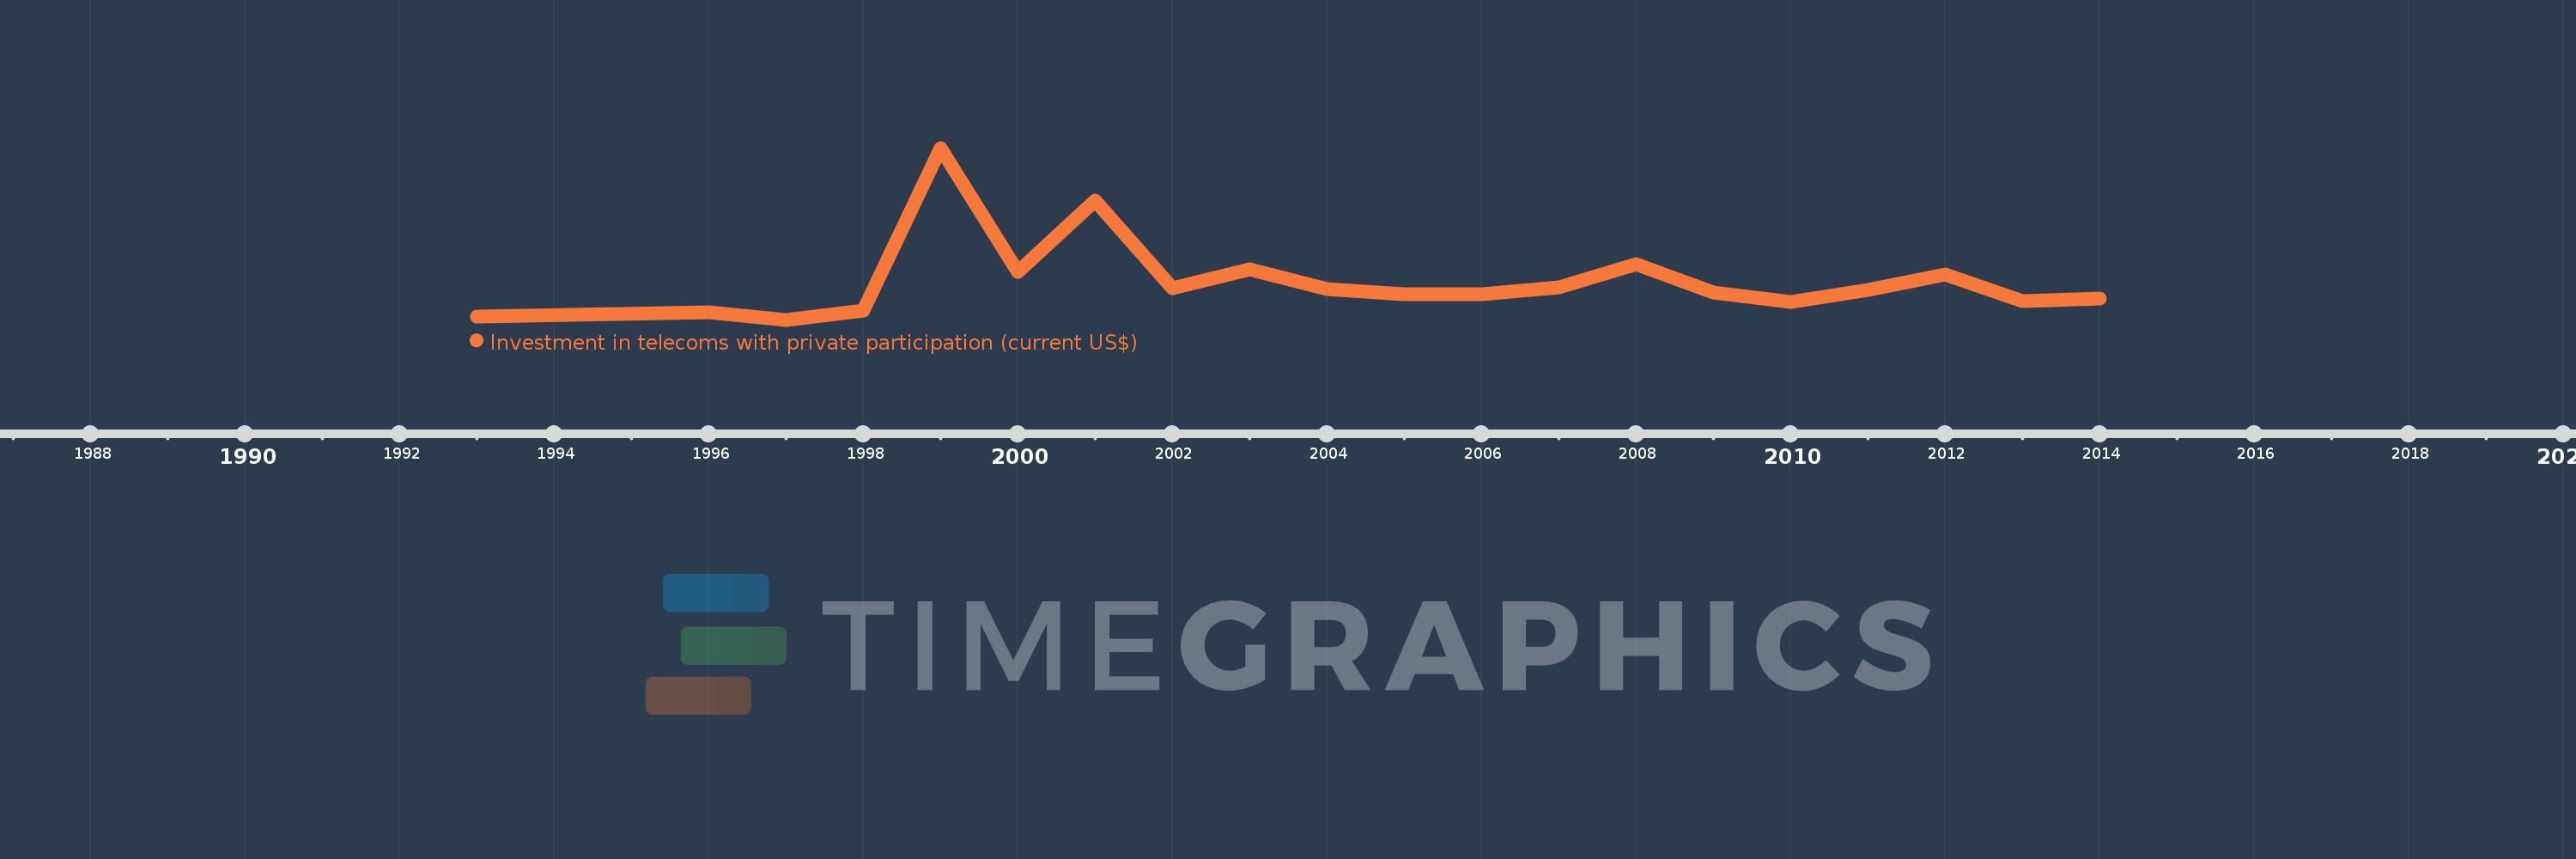
Cette échelle de temps montre un graphique de 1993 année à 2014 année Lithuania. Les données jusqu'à 1992 année ne sont pas présentés. Quantité d'observations actuelles selon dates: 20.
Source (désignation):
Les indicateurs du développement mondiale
Source (organisation):
World Bank, Private Participation in Infrastructure Project Database (http://ppi.worldbank.org).
Catégories:
Infrastructure, Private Sector
Dernière mise à jour
23 avr. 2017
Les indicateurs de changement de valeurs selon les années
En moyenne:
139.087 mln.
Minimum:
20.0 mln.
1 janv. 1997
Maximum:
551.5 mln.
1 janv. 1999
Pour la date d''observation
Valeur
Changement absolu
Le changement par rapport à la valeur précédente
1 janv. 1993
30.0 mln.
+30.0 mln.
0.0%
1 janv. 1996
44.22 mln.
+14.22 mln.
47.4%
1 janv. 1997
20.0 mln.
-24.22 mln.
-54.77%
1 janv. 1998
49.0 mln.
+29.0 mln.
145.0%
1 janv. 1999
551.5 mln.
+502.5 mln.
1.03 milles%
1 janv. 2000
168.0 mln.
-383.5 mln.
-69.54%
1 janv. 2001
387.8 mln.
+219.8 mln.
130.83%
1 janv. 2002
118.5 mln.
-269.3 mln.
-69.44%
1 janv. 2003
175.3 mln.
+56.8 mln.
47.93%
1 janv. 2004
113.9 mln.
-61.4 mln.
-35.03%
1 janv. 2005
99.5 mln.
-14.4 mln.
-12.64%
1 janv. 2006
98.0 mln.
-1.5 mln.
-1.51%
1 janv. 2007
119.0 mln.
+21.0 mln.
21.43%
1 janv. 2008
193.2 mln.
+74.2 mln.
62.35%
1 janv. 2009
103.0 mln.
-90.2 mln.
-46.69%
1 janv. 2010
75.0 mln.
-28.0 mln.
-27.18%
1 janv. 2011
111.7 mln.
+36.7 mln.
48.93%
1 janv. 2012
160.8 mln.
+49.1 mln.
43.96%
1 janv. 2013
78.23 mln.
-82.57 mln.
-51.35%
1 janv. 2014
85.096 mln.
+6.866 mln.
8.78%
Classement des pays selon les statistiques actuelles par années

Commentaires:

Envoyer
PremiumAbout & FeedbackUn accordConfidentialité
logo
© 2022 Selected Technologies LLC – Morgan Hill, California