33
/fr/
AIzaSyAYiBZKx7MnpbEhh9jyipgxe19OcubqV5w
August 1, 2025
210570
Nicaragua
NIC
true
2
1
Investment in telecoms with private participation (current US$)
2016,2015,2014,2013,2012,2011,2010,2009,2008,2007,2006,2005,2004,2003,2002,1998,1997,1996,1995,1994
Download
Bibliothèque de statistiques globales →Nicaragua →

Investment in telecoms with private participation (current US$)

Cette statistique dans les autres pays:

AfghanistanAlbaniaAlgeriaAmerican SamoaAngolaAntigua and BarbudaArgentinaArmeniaAzerbaijanBangladeshBelarusBelizeBeninBhutanBoliviaBosnia and HerzegovinaBotswanaBrazilBulgariaBurkina FasoBurundiCabo VerdeCambodiaCameroonCentral African RepublicChadChileChinaColombiaCongo, Dem. Rep.Congo, Rep.Costa RicaCote d'IvoireCubaDominicaDominican RepublicEarly-demographic dividendEast Asia & Pacific (excluding high income)East Asia & Pacific (IDA & IBRD countries)EcuadorEgypt, Arab Rep.El SalvadorEritreaEthiopiaEurope & Central Asia (excluding high income)Europe & Central Asia (IDA & IBRD countries)FijiFragile and conflict affected situationsGabonGambia, TheGeorgiaGhanaGrenadaGuatemalaGuineaGuinea-BissauGuyanaHaitiHeavily indebted poor countries (HIPC)HondurasIBRD onlyIDA & IBRD totalIDA blendIDA onlyIDA totalIndiaIndonesiaIran, Islamic Rep.IraqJamaicaJordanKazakhstanKenyaKiribatiKorea, Dem. People’s Rep.KosovoKyrgyz RepublicLao PDRLate-demographic dividendLatin America & Caribbean Latin America & Caribbean (excluding high income)Latin America & the Caribbean (IDA & IBRD countries)Least developed countries: UN classificationLebanonLesothoLiberiaLithuaniaLow & middle incomeLow incomeLower middle incomeMacedonia, FYRMadagascarMalawiMalaysiaMaldivesMaliMauritaniaMauritiusMexicoMicronesia, Fed. Sts.Middle East & North Africa (excluding high income)Middle East & North Africa (IDA & IBRD countries)Middle incomeMoldovaMongoliaMontenegroMoroccoMozambiqueMyanmarNamibiaNepalNicaraguaNigerNigeriaOther small statesPacific island small statesPakistanPanamaPapua New GuineaParaguayPeruPhilippinesPre-demographic dividendRomaniaRussian FederationRwandaSamoaSenegalSerbiaSeychellesSierra LeoneSomaliaSouth AfricaSouth AsiaSouth Asia (IDA & IBRD)South SudanSri LankaSt. Kitts and NevisSt. LuciaSt. Vincent and the GrenadinesSub-Saharan Africa Sub-Saharan Africa (excluding high income)Sub-Saharan Africa (IDA & IBRD countries)SudanSurinameSwazilandSyrian Arab RepublicTajikistanTanzaniaThailandTimor-LesteTogoTongaTunisiaTurkeyTurkmenistanUgandaUkraineUpper middle incomeUruguayUzbekistanVanuatuVenezuela, RBVietnamWest Bank and GazaYemen, Rep.ZambiaZimbabwe

La ligne de temps

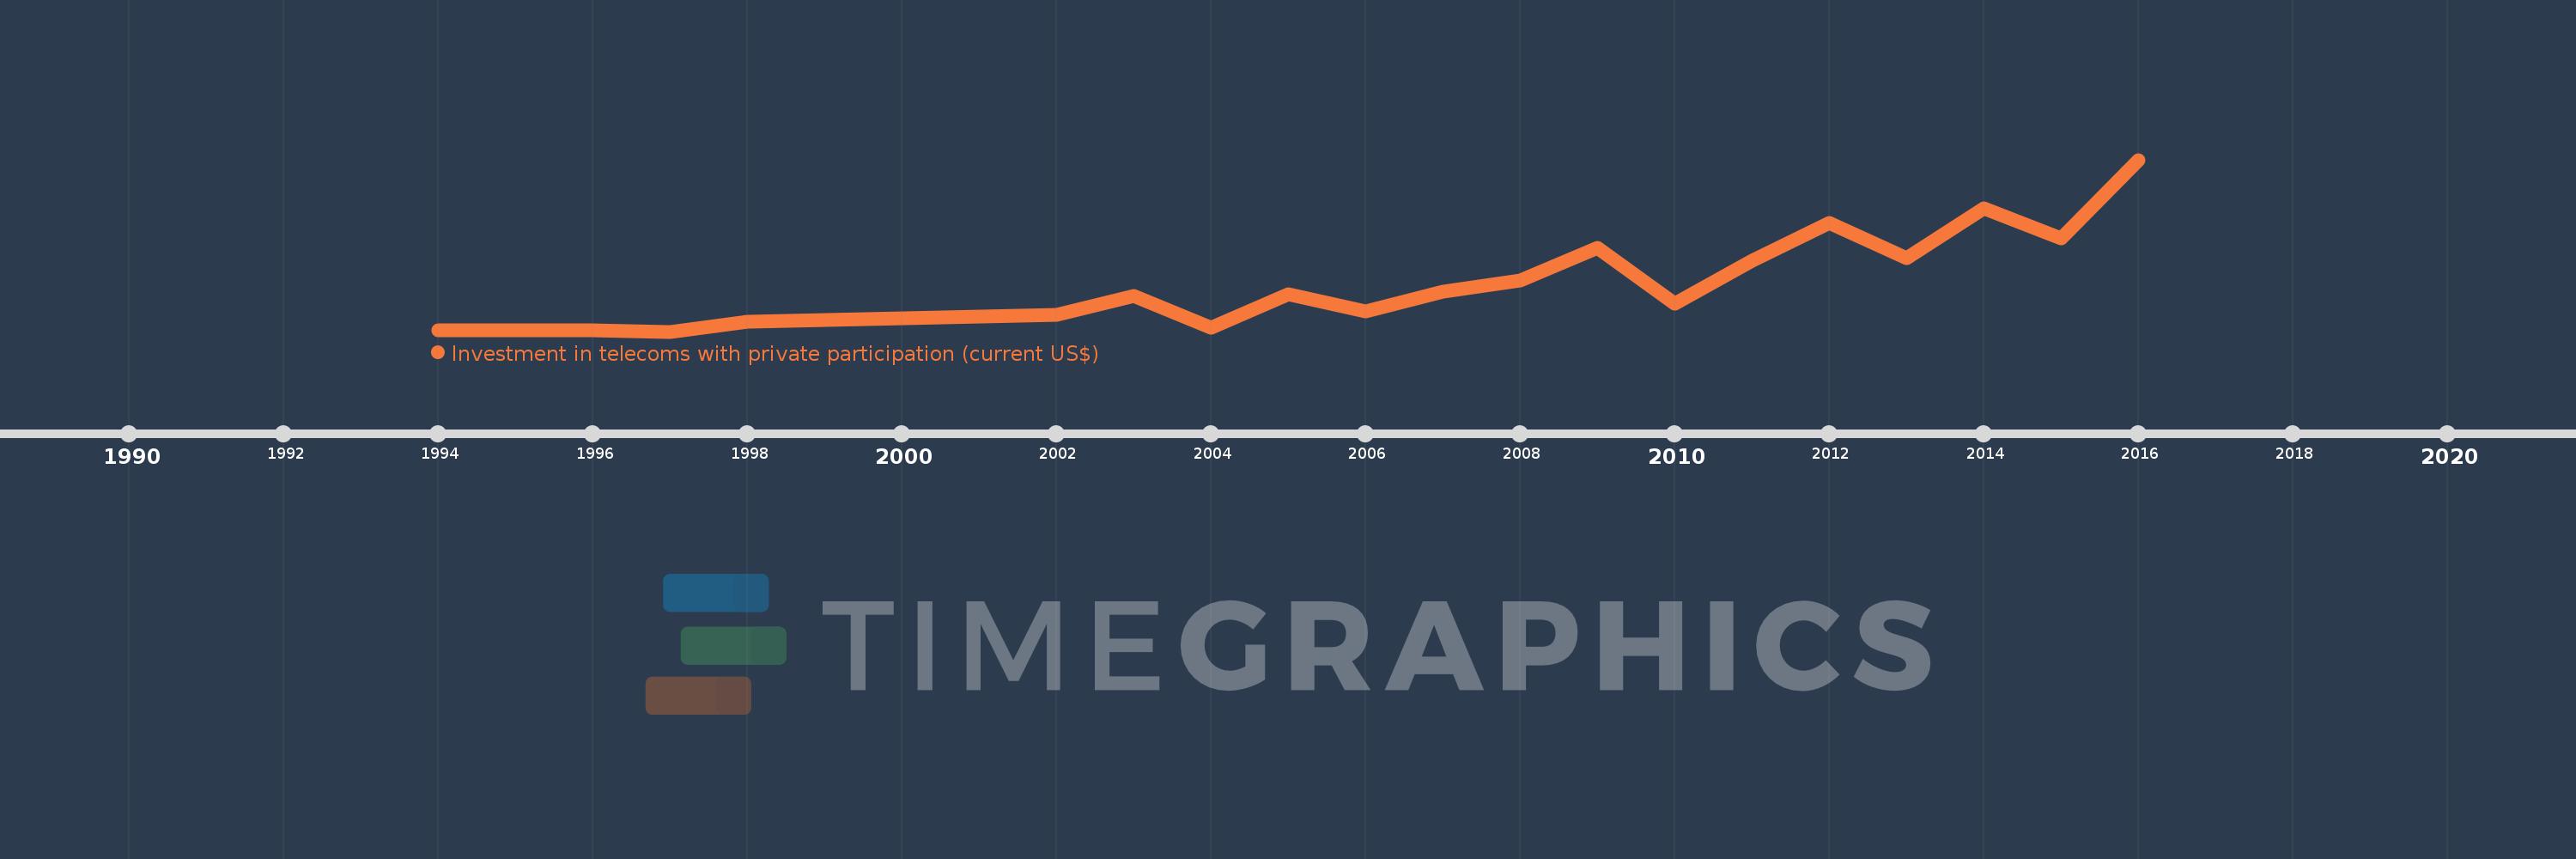
Cette échelle de temps montre un graphique de 1994 année à 2016 année Nicaragua. Les données jusqu'à 1993 année ne sont pas présentés. Quantité d'observations actuelles selon dates: 20.

Source (désignation):

Les indicateurs du développement mondiale

Source (organisation):

World Bank, Private Participation in Infrastructure Project Database (http://ppi.worldbank.org).

Catégories:

Infrastructure, Private Sector

Dernière mise à jour

23 avr. 2017

Les indicateurs de changement de valeurs selon les années

En moyenne:
91.337 mln.
Minimum:
1.2 mln.
1 janv. 1997
Maximum:
320.0 mln.
1 janv. 2016
Pour la date d''observation
Valeur
Changement absolu
Le changement par rapport à la valeur précédente
1 janv. 1994
3.3 mln.
+3.3 mln.
0.0%
1 janv. 1995
3.3 mln.
0.0
0.0%
1 janv. 1996
3.3 mln.
0.0
0.0%
1 janv. 1997
1.2 mln.
-2.1 mln.
-63.64%
1 janv. 1998
20.0 mln.
+18.8 mln.
1.57 milles%
1 janv. 2002
33.0 mln.
+13.0 mln.
65.0%
1 janv. 2003
68.04 mln.
+35.04 mln.
106.18%
1 janv. 2004
8.6 mln.
-59.44 mln.
-87.36%
1 janv. 2005
70.7 mln.
+62.1 mln.
722.09%
1 janv. 2006
38.2 mln.
-32.5 mln.
-45.97%
1 janv. 2007
75.8 mln.
+37.6 mln.
98.43%
1 janv. 2008
95.4 mln.
+19.6 mln.
25.86%
1 janv. 2009
156.0 mln.
+60.6 mln.
63.52%
1 janv. 2010
52.9 mln.
-103.1 mln.
-66.09%
1 janv. 2011
132.1 mln.
+79.2 mln.
149.72%
1 janv. 2012
203.5 mln.
+71.4 mln.
54.05%
1 janv. 2013
137.8 mln.
-65.7 mln.
-32.29%
1 janv. 2014
230.0 mln.
+92.2 mln.
66.91%
1 janv. 2015
173.6 mln.
-56.4 mln.
-24.52%
1 janv. 2016
320.0 mln.
+146.4 mln.
84.33%

Classement des pays selon les statistiques actuelles par années