29
/fr/
fr
AIzaSyAYiBZKx7MnpbEhh9jyipgxe19OcubqV5w
April 1, 2024
140581
Ghana
GHA
true
2
1
Investment in telecoms with private participation (current US$)
2015,2014,2013,2012,2011,2010,2009,2008,2007,2006,2005,2004,2003,2002,2001,2000,1999,1998,1997,1996,1993
Download
Bibliothèque de statistiques globales →Ghana →

Investment in telecoms with private participation (current US$)

Cette statistique dans les autres pays:
AfghanistanAlbaniaAlgeriaAmerican SamoaAngolaAntigua and BarbudaArgentinaArmeniaAzerbaijanBangladeshBelarusBelizeBeninBhutanBoliviaBosnia and HerzegovinaBotswanaBrazilBulgariaBurkina FasoBurundiCabo VerdeCambodiaCameroonCentral African RepublicChadChileChinaColombiaCongo, Dem. Rep.Congo, Rep.Costa RicaCote d'IvoireCubaDominicaDominican RepublicEarly-demographic dividendEast Asia & Pacific (excluding high income)East Asia & Pacific (IDA & IBRD countries)EcuadorEgypt, Arab Rep.El SalvadorEritreaEthiopiaEurope & Central Asia (excluding high income)Europe & Central Asia (IDA & IBRD countries)FijiFragile and conflict affected situationsGabonGambia, TheGeorgiaGhanaGrenadaGuatemalaGuineaGuinea-BissauGuyanaHaitiHeavily indebted poor countries (HIPC)HondurasIBRD onlyIDA & IBRD totalIDA blendIDA onlyIDA totalIndiaIndonesiaIran, Islamic Rep.IraqJamaicaJordanKazakhstanKenyaKiribatiKorea, Dem. People’s Rep.KosovoKyrgyz RepublicLao PDRLate-demographic dividendLatin America & Caribbean Latin America & Caribbean (excluding high income)Latin America & the Caribbean (IDA & IBRD countries)Least developed countries: UN classificationLebanonLesothoLiberiaLithuaniaLow & middle incomeLow incomeLower middle incomeMacedonia, FYRMadagascarMalawiMalaysiaMaldivesMaliMauritaniaMauritiusMexicoMicronesia, Fed. Sts.Middle East & North Africa (excluding high income)Middle East & North Africa (IDA & IBRD countries)Middle incomeMoldovaMongoliaMontenegroMoroccoMozambiqueMyanmarNamibiaNepalNicaraguaNigerNigeriaOther small statesPacific island small statesPakistanPanamaPapua New GuineaParaguayPeruPhilippinesPre-demographic dividendRomaniaRussian FederationRwandaSamoaSenegalSerbiaSeychellesSierra LeoneSomaliaSouth AfricaSouth AsiaSouth Asia (IDA & IBRD)South SudanSri LankaSt. Kitts and NevisSt. LuciaSt. Vincent and the GrenadinesSub-Saharan Africa Sub-Saharan Africa (excluding high income)Sub-Saharan Africa (IDA & IBRD countries)SudanSurinameSwazilandSyrian Arab RepublicTajikistanTanzaniaThailandTimor-LesteTogoTongaTunisiaTurkeyTurkmenistanUgandaUkraineUpper middle incomeUruguayUzbekistanVanuatuVenezuela, RBVietnamWest Bank and GazaYemen, Rep.ZambiaZimbabwe
La ligne de temps
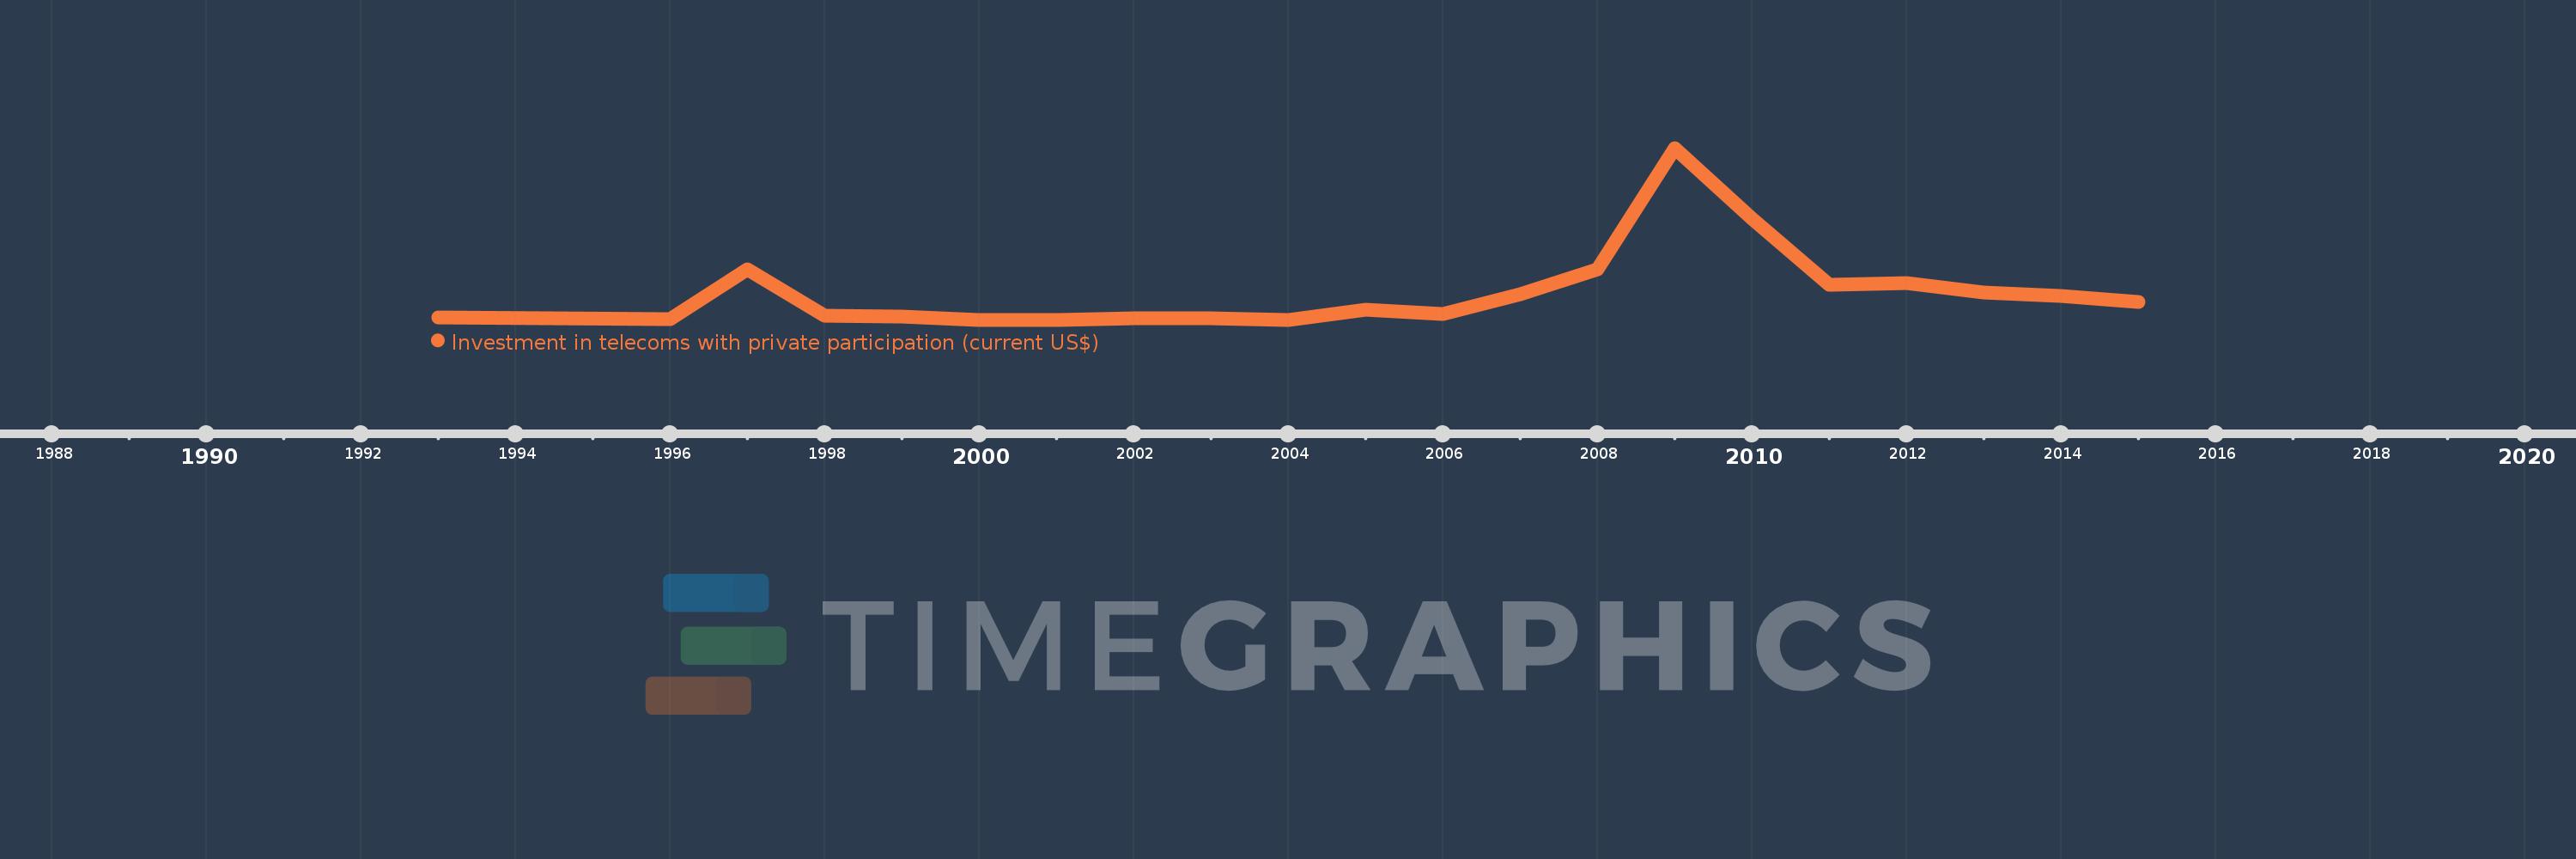
Cette échelle de temps montre un graphique de 1993 année à 2015 année Ghana. Les données jusqu'à 1992 année ne sont pas présentés. Quantité d'observations actuelles selon dates: 21.
Source (désignation):
Les indicateurs du développement mondiale
Source (organisation):
World Bank, Private Participation in Infrastructure Project Database (http://ppi.worldbank.org).
Catégories:
Infrastructure, Private Sector
Dernière mise à jour
23 avr. 2017
Les indicateurs de changement de valeurs selon les années
En moyenne:
226.408 mln.
Minimum:
0.0
1 janv. 2000
Maximum:
1.434 mds
1 janv. 2009
Pour la date d''observation
Valeur
Changement absolu
Le changement par rapport à la valeur précédente
1 janv. 1993
20.0 mln.
+20.0 mln.
0.0%
1 janv. 1996
5.0 mln.
-15.0 mln.
-75.0%
1 janv. 1997
424.0 mln.
+419.0 mln.
8.38 milles%
1 janv. 1998
35.1 mln.
-388.9 mln.
-91.72%
1 janv. 1999
27.0 mln.
-8.1 mln.
-23.08%
1 janv. 2000
0.0
-27.0 mln.
-100.0%
1 janv. 2001
0.0
0.0
%
1 janv. 2002
12.0 mln.
+12.0 mln.
%
1 janv. 2003
12.0 mln.
0.0
0.0%
1 janv. 2004
275.0 milles
-11.725 mln.
-97.71%
1 janv. 2005
80.6 mln.
+80.325 mln.
29.21 milles%
1 janv. 2006
51.6 mln.
-29.0 mln.
-35.98%
1 janv. 2007
215.0 mln.
+163.4 mln.
316.67%
1 janv. 2008
420.0 mln.
+205.0 mln.
95.35%
1 janv. 2009
1.434 mds
+1.014 mds
241.43%
1 janv. 2010
847.0 mln.
-587.0 mln.
-40.93%
1 janv. 2011
290.0 mln.
-557.0 mln.
-65.76%
1 janv. 2012
305.5 mln.
+15.5 mln.
5.34%
1 janv. 2013
226.7 mln.
-78.8 mln.
-25.79%
1 janv. 2014
197.8 mln.
-28.9 mln.
-12.75%
1 janv. 2015
151.0 mln.
-46.8 mln.
-23.66%
Classement des pays selon les statistiques actuelles par années

Commentaires:

Envoyer
PremiumAbout & FeedbackUn accordConfidentialité
logo
© 2022 Selected Technologies LLC – Morgan Hill, California