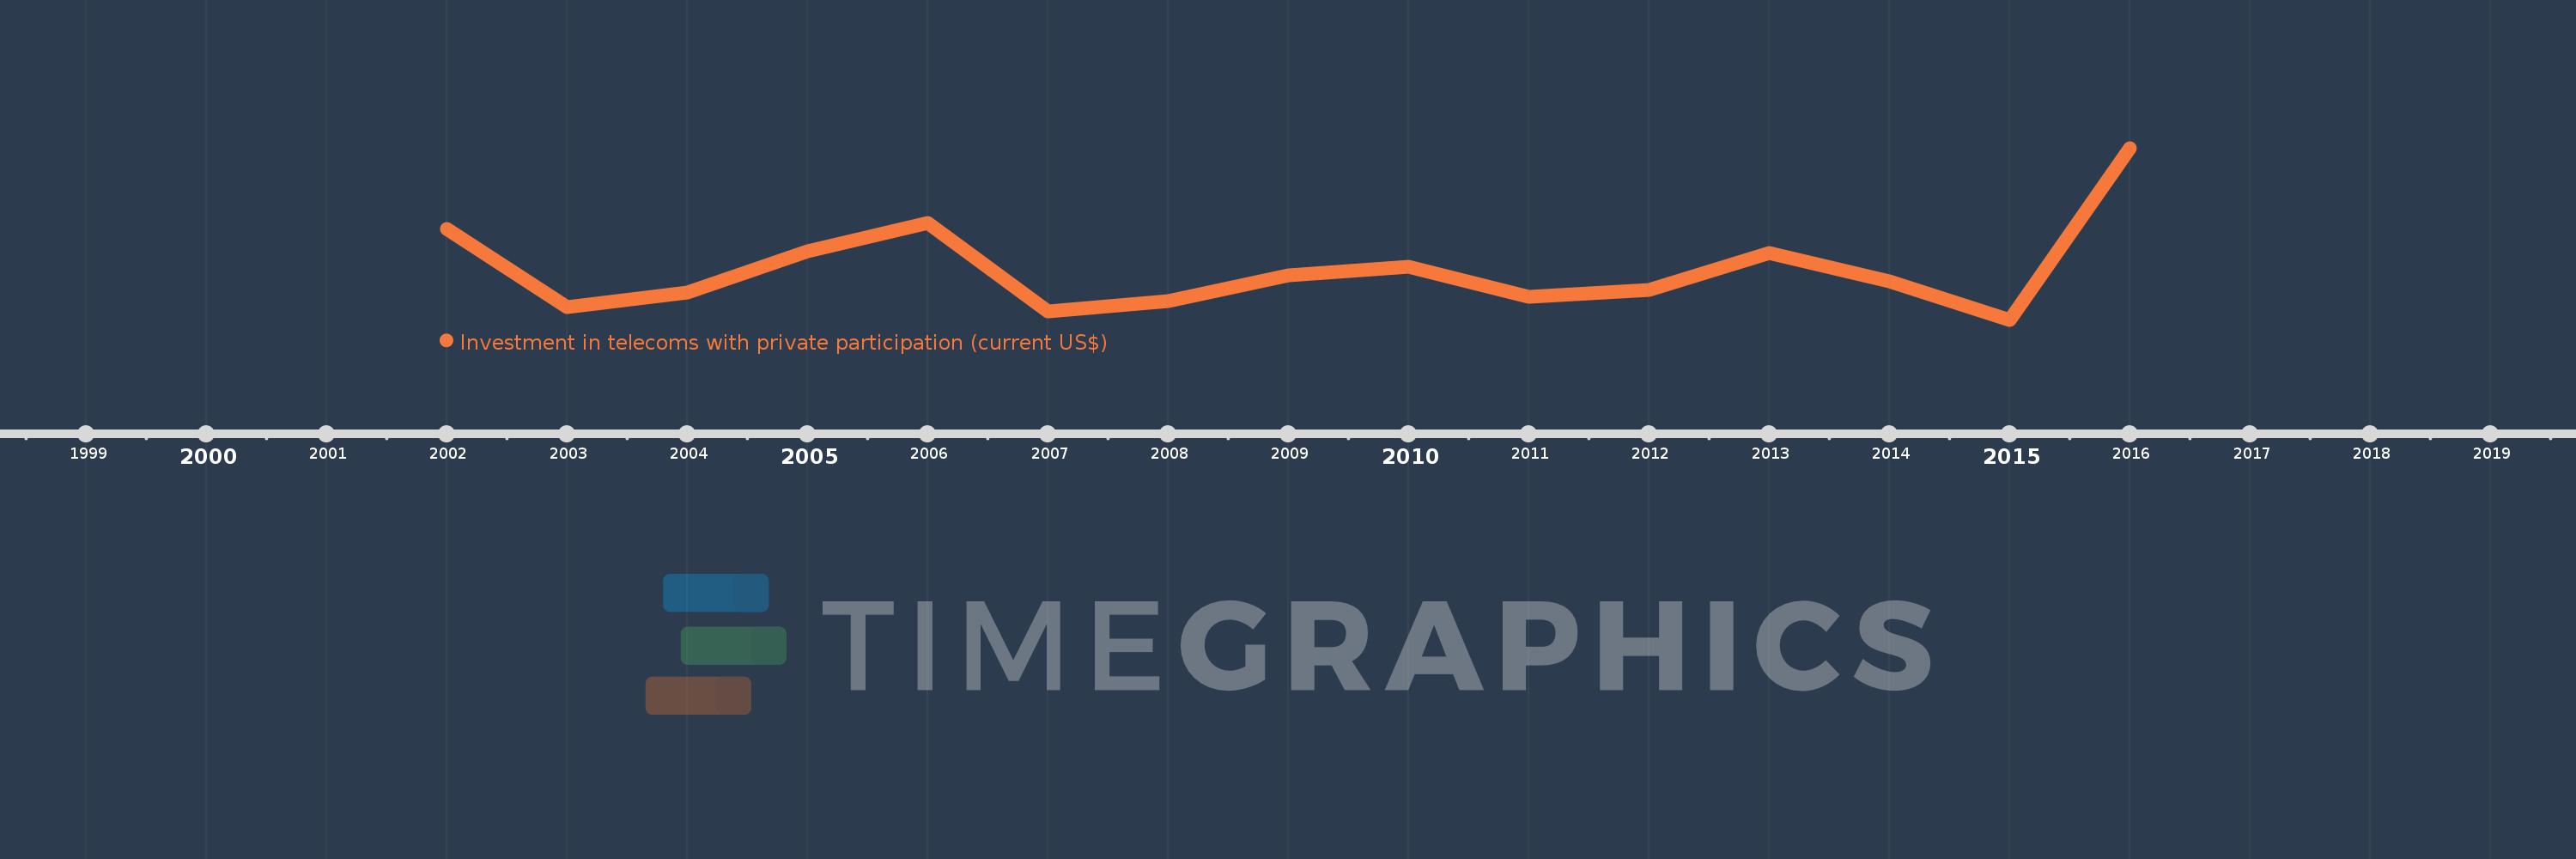
Cette échelle de temps montre un graphique de 2002 année à 2016 année Syrian Arab Republic. Les données jusqu'à 2001 année ne sont pas présentés. Quantité d'observations actuelles selon dates: 15.
Source (désignation):
Les indicateurs du développement mondiale
Source (organisation):
World Bank, Private Participation in Infrastructure Project Database (http://ppi.worldbank.org).
Catégories:
Infrastructure, Private Sector
Dernière mise à jour
23 avr. 2017
Les indicateurs de changement de valeurs selon les années
En moyenne:
103.607 mln.
Minimum:
32.9 mln.
1 janv. 2015
Maximum:
276.0 mln.
1 janv. 2016
Pour la date d''observation
Valeur
Changement absolu
Le changement par rapport à la valeur précédente
1 janv. 2002
161.0 mln.
+161.0 mln.
0.0%
1 janv. 2003
51.25 mln.
-109.75 mln.
-68.17%
1 janv. 2004
71.25 mln.
+20.0 mln.
39.02%
1 janv. 2005
129.25 mln.
+58.0 mln.
81.4%
1 janv. 2006
170.25 mln.
+41.0 mln.
31.72%
1 janv. 2007
45.0 mln.
-125.25 mln.
-73.57%
1 janv. 2008
59.3 mln.
+14.3 mln.
31.78%
1 janv. 2009
95.4 mln.
+36.1 mln.
60.88%
1 janv. 2010
108.0 mln.
+12.6 mln.
13.21%
1 janv. 2011
65.0 mln.
-43.0 mln.
-39.81%
1 janv. 2012
75.0 mln.
+10.0 mln.
15.38%
1 janv. 2013
127.5 mln.
+52.5 mln.
70.0%
1 janv. 2014
87.0 mln.
-40.5 mln.
-31.76%
1 janv. 2015
32.9 mln.
-54.1 mln.
-62.18%
1 janv. 2016
276.0 mln.
+243.1 mln.
738.91%
Classement des pays selon les statistiques actuelles par années