33
/fr/
AIzaSyAYiBZKx7MnpbEhh9jyipgxe19OcubqV5w
August 1, 2025
80731
Belarus
BLR
true
2
1
Investment in telecoms with private participation (current US$)
2015,2014,2013,2012,2011,2010,2009,2008,2007,2006,2005,2004,2003,2002,1999,1993
Download
Bibliothèque de statistiques globales →Belarus →

Investment in telecoms with private participation (current US$)

Cette statistique dans les autres pays:

AfghanistanAlbaniaAlgeriaAmerican SamoaAngolaAntigua and BarbudaArgentinaArmeniaAzerbaijanBangladeshBelarusBelizeBeninBhutanBoliviaBosnia and HerzegovinaBotswanaBrazilBulgariaBurkina FasoBurundiCabo VerdeCambodiaCameroonCentral African RepublicChadChileChinaColombiaCongo, Dem. Rep.Congo, Rep.Costa RicaCote d'IvoireCubaDominicaDominican RepublicEarly-demographic dividendEast Asia & Pacific (excluding high income)East Asia & Pacific (IDA & IBRD countries)EcuadorEgypt, Arab Rep.El SalvadorEritreaEthiopiaEurope & Central Asia (excluding high income)Europe & Central Asia (IDA & IBRD countries)FijiFragile and conflict affected situationsGabonGambia, TheGeorgiaGhanaGrenadaGuatemalaGuineaGuinea-BissauGuyanaHaitiHeavily indebted poor countries (HIPC)HondurasIBRD onlyIDA & IBRD totalIDA blendIDA onlyIDA totalIndiaIndonesiaIran, Islamic Rep.IraqJamaicaJordanKazakhstanKenyaKiribatiKorea, Dem. People’s Rep.KosovoKyrgyz RepublicLao PDRLate-demographic dividendLatin America & Caribbean Latin America & Caribbean (excluding high income)Latin America & the Caribbean (IDA & IBRD countries)Least developed countries: UN classificationLebanonLesothoLiberiaLithuaniaLow & middle incomeLow incomeLower middle incomeMacedonia, FYRMadagascarMalawiMalaysiaMaldivesMaliMauritaniaMauritiusMexicoMicronesia, Fed. Sts.Middle East & North Africa (excluding high income)Middle East & North Africa (IDA & IBRD countries)Middle incomeMoldovaMongoliaMontenegroMoroccoMozambiqueMyanmarNamibiaNepalNicaraguaNigerNigeriaOther small statesPacific island small statesPakistanPanamaPapua New GuineaParaguayPeruPhilippinesPre-demographic dividendRomaniaRussian FederationRwandaSamoaSenegalSerbiaSeychellesSierra LeoneSomaliaSouth AfricaSouth AsiaSouth Asia (IDA & IBRD)South SudanSri LankaSt. Kitts and NevisSt. LuciaSt. Vincent and the GrenadinesSub-Saharan Africa Sub-Saharan Africa (excluding high income)Sub-Saharan Africa (IDA & IBRD countries)SudanSurinameSwazilandSyrian Arab RepublicTajikistanTanzaniaThailandTimor-LesteTogoTongaTunisiaTurkeyTurkmenistanUgandaUkraineUpper middle incomeUruguayUzbekistanVanuatuVenezuela, RBVietnamWest Bank and GazaYemen, Rep.ZambiaZimbabwe

La ligne de temps

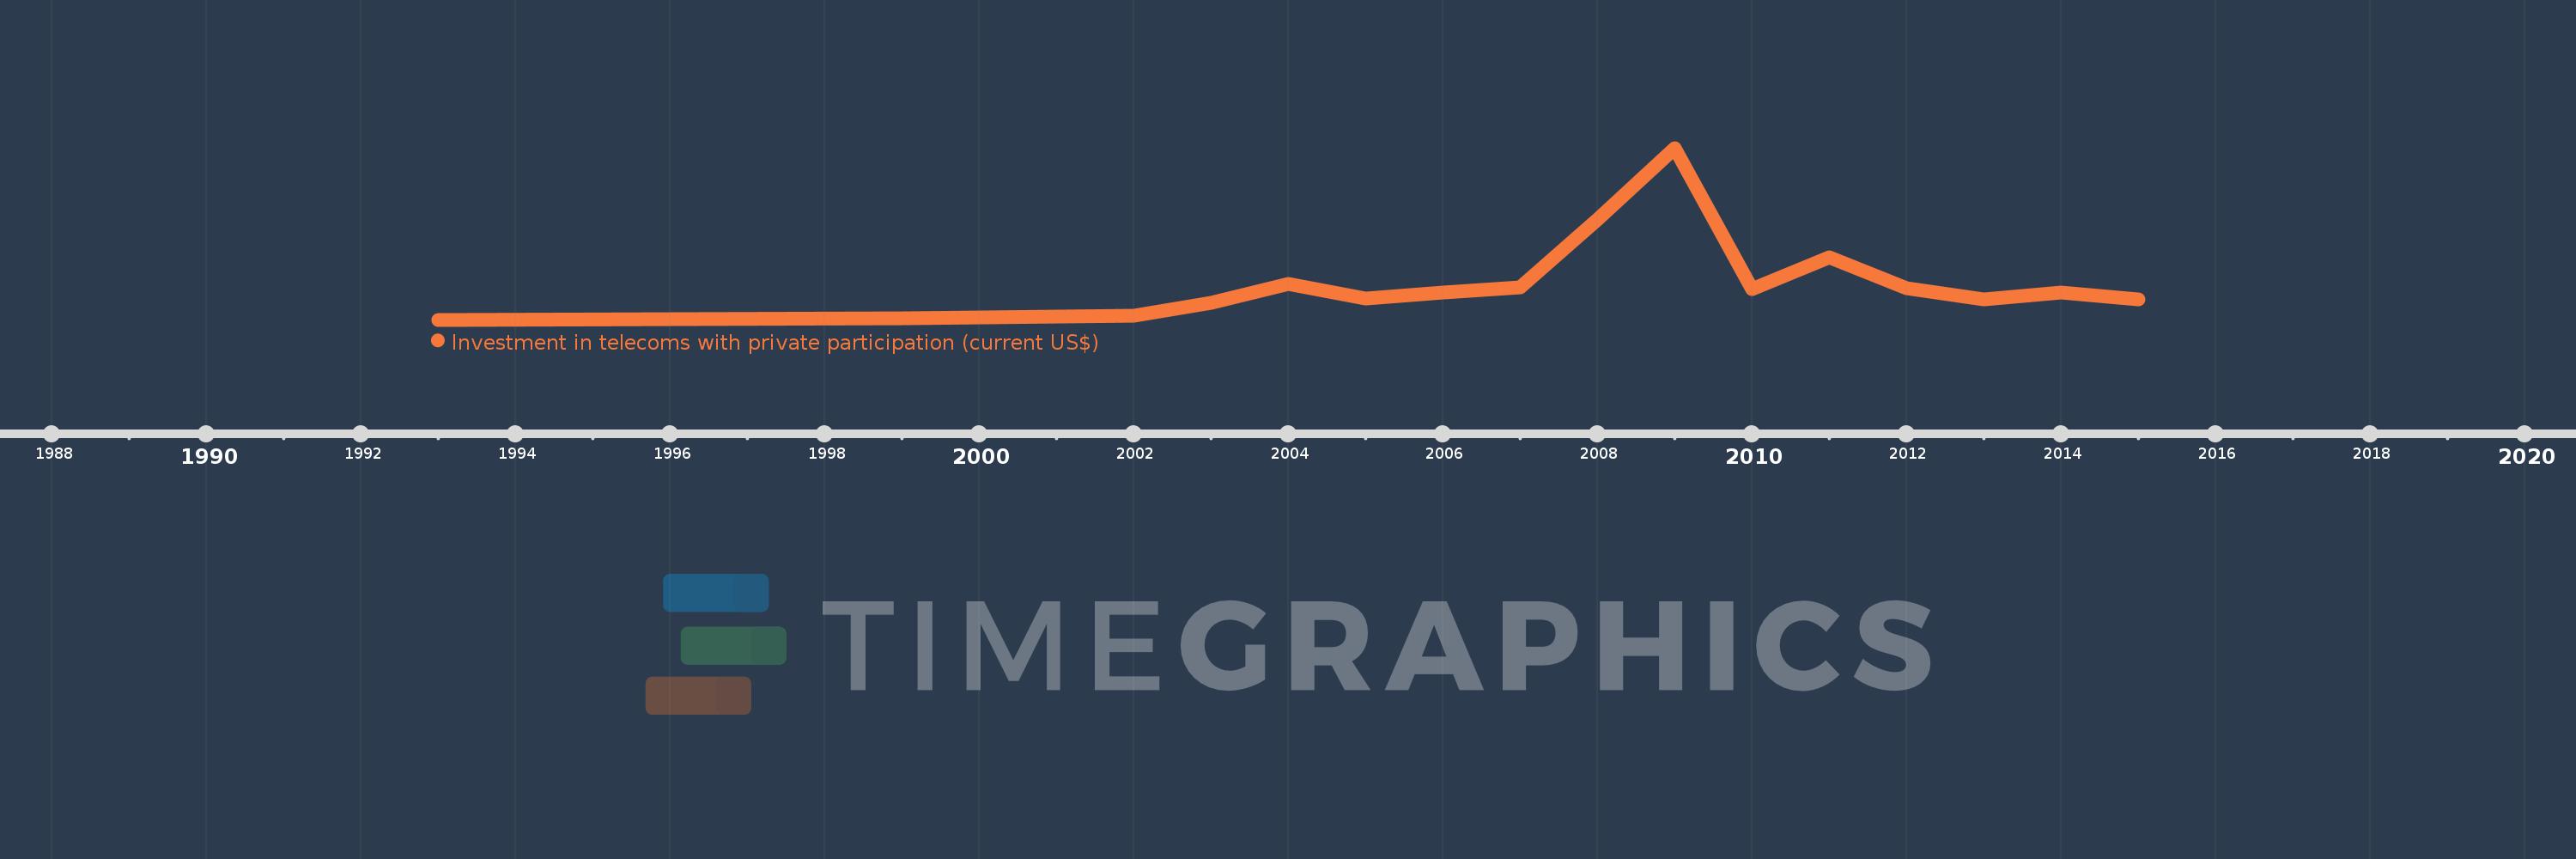
Cette échelle de temps montre un graphique de 1993 année à 2015 année Belarus. Les données jusqu'à 1992 année ne sont pas présentés. Quantité d'observations actuelles selon dates: 16.

Source (désignation):

Les indicateurs du développement mondiale

Source (organisation):

World Bank, Private Participation in Infrastructure Project Database (http://ppi.worldbank.org).

Catégories:

Infrastructure, Private Sector

Dernière mise à jour

23 avr. 2017

Les indicateurs de changement de valeurs selon les années

En moyenne:
255.821 mln.
Minimum:
10.0 mln.
1 janv. 1993
Maximum:
1.13 mds
1 janv. 2009
Pour la date d''observation
Valeur
Changement absolu
Le changement par rapport à la valeur précédente
1 janv. 1993
10.0 mln.
+10.0 mln.
0.0%
1 janv. 1999
20.0 mln.
+10.0 mln.
100.0%
1 janv. 2002
38.5 mln.
+18.5 mln.
92.5%
1 janv. 2003
120.3 mln.
+81.8 mln.
212.47%
1 janv. 2004
241.0 mln.
+120.7 mln.
100.33%
1 janv. 2005
148.0 mln.
-93.0 mln.
-38.59%
1 janv. 2006
187.6 mln.
+39.6 mln.
26.76%
1 janv. 2007
220.4 mln.
+32.8 mln.
17.48%
1 janv. 2008
660.9 mln.
+440.5 mln.
199.86%
1 janv. 2009
1.13 mds
+469.1 mln.
70.98%
1 janv. 2010
207.9 mln.
-922.1 mln.
-81.6%
1 janv. 2011
419.5 mln.
+211.6 mln.
101.78%
1 janv. 2012
215.39 mln.
-204.11 mln.
-48.66%
1 janv. 2013
143.04 mln.
-72.35 mln.
-33.59%
1 janv. 2014
187.74 mln.
+44.7 mln.
31.25%
1 janv. 2015
142.86 mln.
-44.88 mln.
-23.91%

Classement des pays selon les statistiques actuelles par années