33
/fr/
AIzaSyAYiBZKx7MnpbEhh9jyipgxe19OcubqV5w
August 1, 2025
284810
Yemen, Rep.
YEM
true
2
1
Investment in telecoms with private participation (current US$)
2015,2014,2013,2012,2011,2010,2009,2008,2007,2006,2005,2004,2003,2002,2001,1994,1993,1991
Download
Bibliothèque de statistiques globales →Yemen, Rep. →

Investment in telecoms with private participation (current US$)

Cette statistique dans les autres pays:

AfghanistanAlbaniaAlgeriaAmerican SamoaAngolaAntigua and BarbudaArgentinaArmeniaAzerbaijanBangladeshBelarusBelizeBeninBhutanBoliviaBosnia and HerzegovinaBotswanaBrazilBulgariaBurkina FasoBurundiCabo VerdeCambodiaCameroonCentral African RepublicChadChileChinaColombiaCongo, Dem. Rep.Congo, Rep.Costa RicaCote d'IvoireCubaDominicaDominican RepublicEarly-demographic dividendEast Asia & Pacific (excluding high income)East Asia & Pacific (IDA & IBRD countries)EcuadorEgypt, Arab Rep.El SalvadorEritreaEthiopiaEurope & Central Asia (excluding high income)Europe & Central Asia (IDA & IBRD countries)FijiFragile and conflict affected situationsGabonGambia, TheGeorgiaGhanaGrenadaGuatemalaGuineaGuinea-BissauGuyanaHaitiHeavily indebted poor countries (HIPC)HondurasIBRD onlyIDA & IBRD totalIDA blendIDA onlyIDA totalIndiaIndonesiaIran, Islamic Rep.IraqJamaicaJordanKazakhstanKenyaKiribatiKorea, Dem. People’s Rep.KosovoKyrgyz RepublicLao PDRLate-demographic dividendLatin America & Caribbean Latin America & Caribbean (excluding high income)Latin America & the Caribbean (IDA & IBRD countries)Least developed countries: UN classificationLebanonLesothoLiberiaLithuaniaLow & middle incomeLow incomeLower middle incomeMacedonia, FYRMadagascarMalawiMalaysiaMaldivesMaliMauritaniaMauritiusMexicoMicronesia, Fed. Sts.Middle East & North Africa (excluding high income)Middle East & North Africa (IDA & IBRD countries)Middle incomeMoldovaMongoliaMontenegroMoroccoMozambiqueMyanmarNamibiaNepalNicaraguaNigerNigeriaOther small statesPacific island small statesPakistanPanamaPapua New GuineaParaguayPeruPhilippinesPre-demographic dividendRomaniaRussian FederationRwandaSamoaSenegalSerbiaSeychellesSierra LeoneSomaliaSouth AfricaSouth AsiaSouth Asia (IDA & IBRD)South SudanSri LankaSt. Kitts and NevisSt. LuciaSt. Vincent and the GrenadinesSub-Saharan Africa Sub-Saharan Africa (excluding high income)Sub-Saharan Africa (IDA & IBRD countries)SudanSurinameSwazilandSyrian Arab RepublicTajikistanTanzaniaThailandTimor-LesteTogoTongaTunisiaTurkeyTurkmenistanUgandaUkraineUpper middle incomeUruguayUzbekistanVanuatuVenezuela, RBVietnamWest Bank and GazaYemen, Rep.ZambiaZimbabwe

La ligne de temps

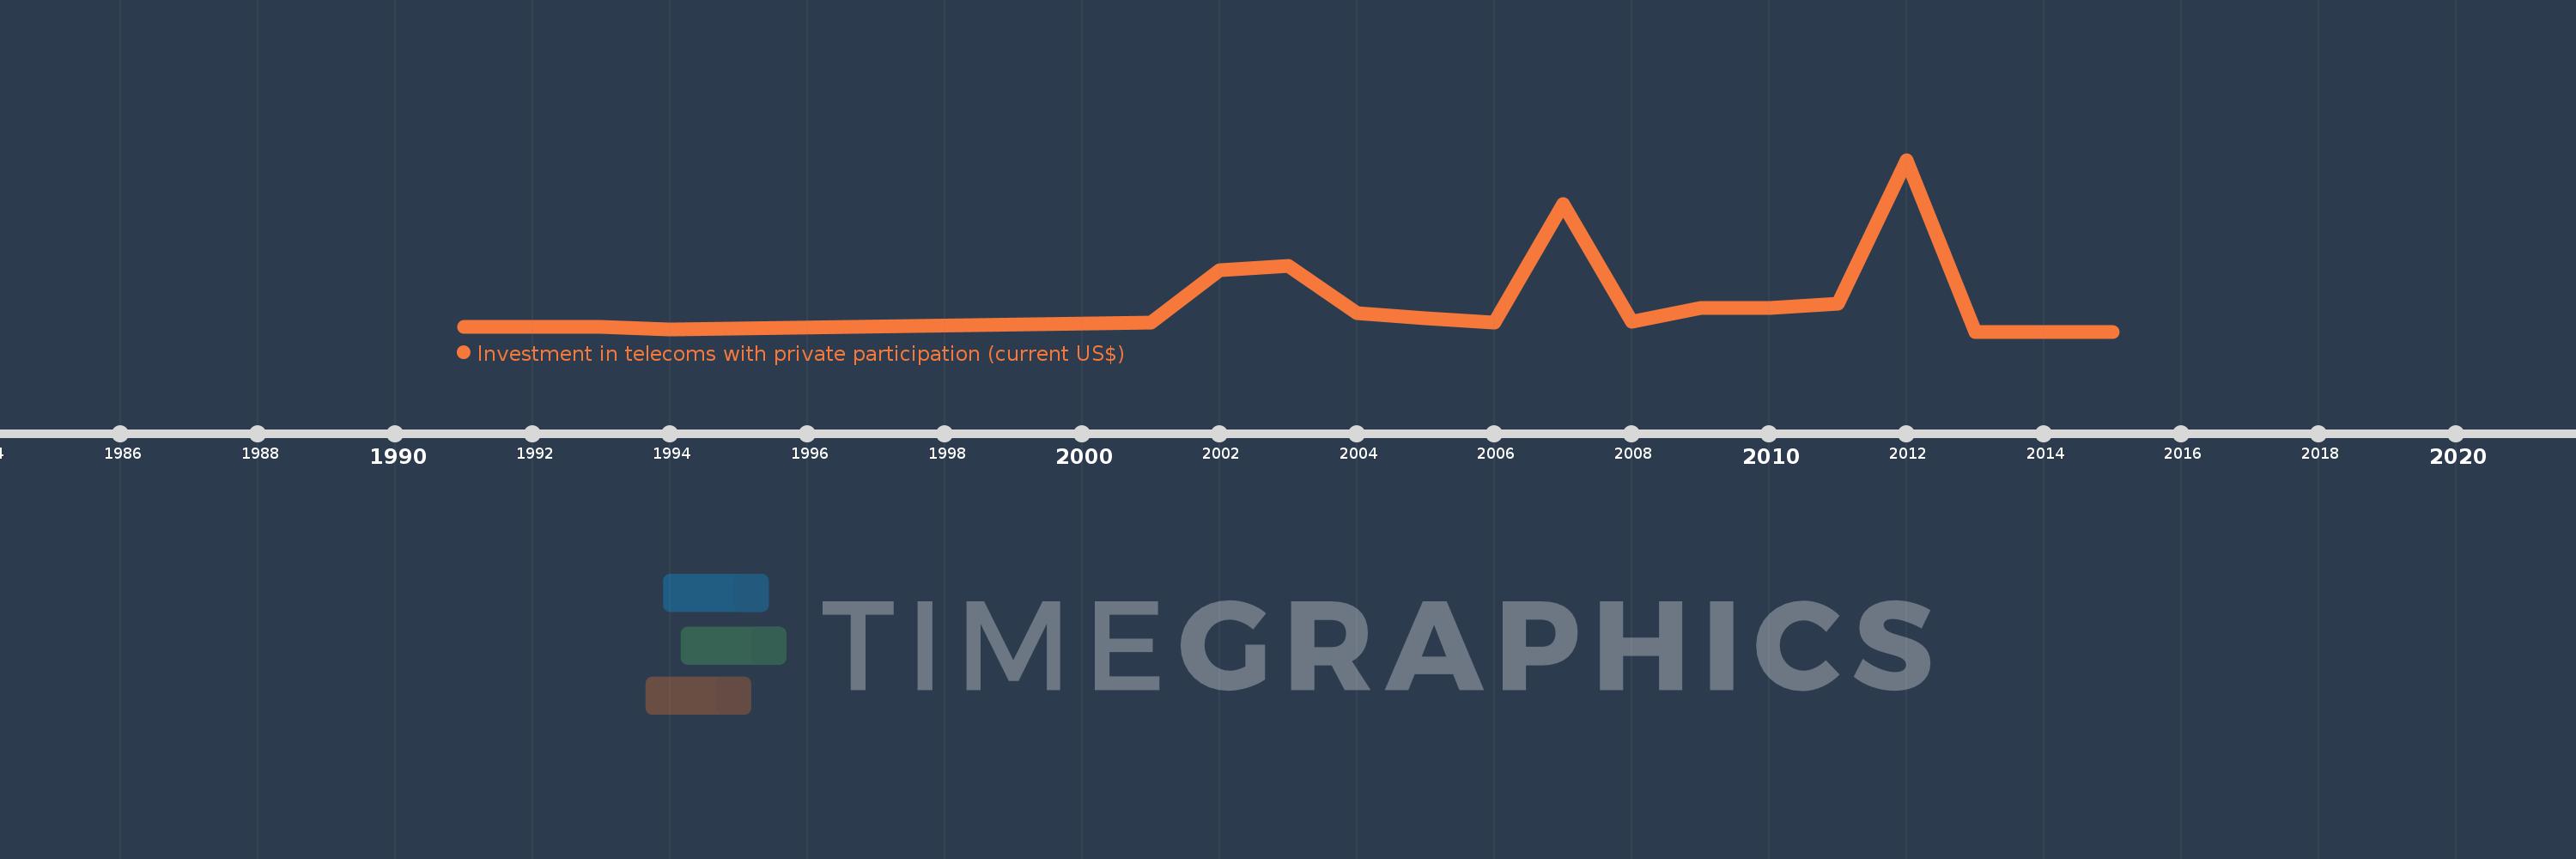
Cette échelle de temps montre un graphique de 1991 année à 2015 année Yemen, Rep.. Les données jusqu'à 1990 année ne sont pas présentés. Quantité d'observations actuelles selon dates: 18.

Source (désignation):

Les indicateurs du développement mondiale

Source (organisation):

World Bank, Private Participation in Infrastructure Project Database (http://ppi.worldbank.org).

Catégories:

Infrastructure, Private Sector

Dernière mise à jour

23 avr. 2017

Les indicateurs de changement de valeurs selon les années

En moyenne:
67.672 mln.
Minimum:
0.0
1 janv. 2013
Maximum:
365.1 mln.
1 janv. 2012
Pour la date d''observation
Valeur
Changement absolu
Le changement par rapport à la valeur précédente
1 janv. 1991
10.0 mln.
+10.0 mln.
0.0%
1 janv. 1993
10.0 mln.
0.0
0.0%
1 janv. 1994
5.0 mln.
-5.0 mln.
-50.0%
1 janv. 2001
20.0 mln.
+15.0 mln.
300.0%
1 janv. 2002
130.0 mln.
+110.0 mln.
550.0%
1 janv. 2003
140.0 mln.
+10.0 mln.
7.69%
1 janv. 2004
40.0 mln.
-100.0 mln.
-71.43%
1 janv. 2005
28.0 mln.
-12.0 mln.
-30.0%
1 janv. 2006
18.8 mln.
-9.2 mln.
-32.86%
1 janv. 2007
270.8 mln.
+252.0 mln.
1.34 milles%
1 janv. 2008
21.3 mln.
-249.5 mln.
-92.13%
1 janv. 2009
50.1 mln.
+28.8 mln.
135.21%
1 janv. 2010
50.0 mln.
-100.0 milles
-0.2%
1 janv. 2011
59.0 mln.
+9.0 mln.
18.0%
1 janv. 2012
365.1 mln.
+306.1 mln.
518.81%
1 janv. 2013
0.0
-365.1 mln.
-100.0%
1 janv. 2014
0.0
0.0
%
1 janv. 2015
0.0
0.0
%

Classement des pays selon les statistiques actuelles par années