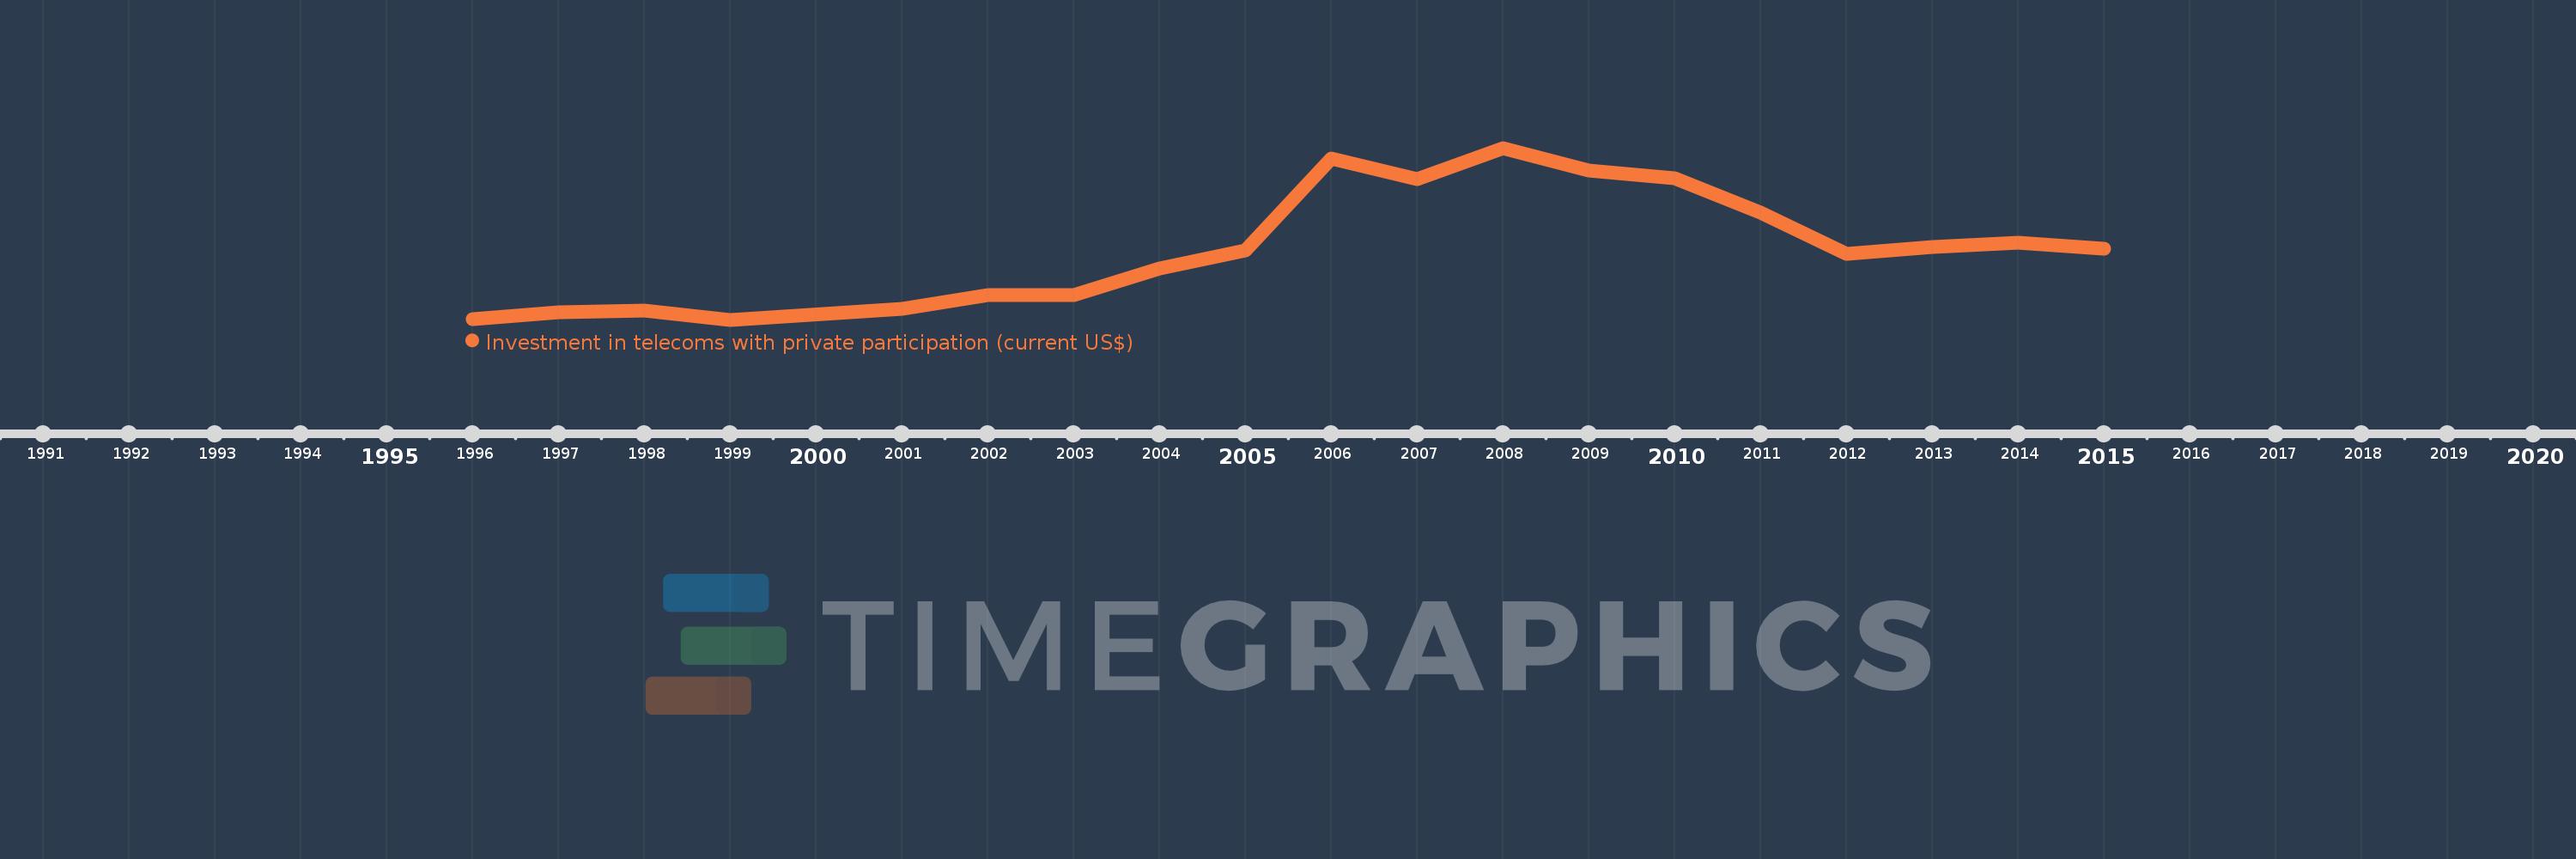
Cette échelle de temps montre un graphique de 1996 année à 2015 année IDA blend. Les données jusqu'à 1995 année ne sont pas présentés. Quantité d'observations actuelles selon dates: 19.
Source (désignation):
Les indicateurs du développement mondiale
Source (organisation):
World Bank, Private Participation in Infrastructure Project Database (http://ppi.worldbank.org).
Catégories:
Infrastructure, Private Sector
Dernière mise à jour
23 avr. 2017
Les indicateurs de changement de valeurs selon les années
En moyenne:
3.309 mds
Minimum:
296.36 mln.
1 janv. 1999
Maximum:
7.544 mds
1 janv. 2008
Pour la date d''observation
Valeur
Changement absolu
Le changement par rapport à la valeur précédente
1 janv. 1996
332.2 mln.
+332.2 mln.
0.0%
1 janv. 1997
618.0 mln.
+285.8 mln.
86.03%
1 janv. 1998
695.2 mln.
+77.2 mln.
12.49%
1 janv. 1999
296.36 mln.
-398.84 mln.
-57.37%
1 janv. 2001
759.6 mln.
+463.24 mln.
156.31%
1 janv. 2002
1.324 mds
+564.8 mln.
74.35%
1 janv. 2003
1.32 mds
-4.5 mln.
-0.34%
1 janv. 2004
2.451 mds
+1.131 mds
85.68%
1 janv. 2005
3.215 mds
+764.5 mln.
31.19%
1 janv. 2006
7.112 mds
+3.896 mds
121.18%
1 janv. 2007
6.234 mds
-877.55 mln.
-12.34%
1 janv. 2008
7.544 mds
+1.31 mds
21.01%
1 janv. 2009
6.591 mds
-953.3 mln.
-12.64%
1 janv. 2010
6.267 mds
-323.7 mln.
-4.91%
1 janv. 2011
4.817 mds
-1.45 mds
-23.14%
1 janv. 2012
3.066 mds
-1.751 mds
-36.35%
1 janv. 2013
3.369 mds
+303.3 mln.
9.89%
1 janv. 2014
3.555 mds
+186.0 mln.
5.52%
1 janv. 2015
3.305 mds
-250.8 mln.
-7.05%
Classement des pays selon les statistiques actuelles par années