33
/fr/
AIzaSyAYiBZKx7MnpbEhh9jyipgxe19OcubqV5w
August 1, 2025
75198
Azerbaijan
AZE
true
2
1
Investment in telecoms with private participation (current US$)
2015,2014,2013,2012,2011,2010,2009,2008,2007,2006,2005,2004,2003,2002,2001,2000,1999,1998,1997,1995
Download
Bibliothèque de statistiques globales →Azerbaijan →

Investment in telecoms with private participation (current US$)

Cette statistique dans les autres pays:

AfghanistanAlbaniaAlgeriaAmerican SamoaAngolaAntigua and BarbudaArgentinaArmeniaAzerbaijanBangladeshBelarusBelizeBeninBhutanBoliviaBosnia and HerzegovinaBotswanaBrazilBulgariaBurkina FasoBurundiCabo VerdeCambodiaCameroonCentral African RepublicChadChileChinaColombiaCongo, Dem. Rep.Congo, Rep.Costa RicaCote d'IvoireCubaDominicaDominican RepublicEarly-demographic dividendEast Asia & Pacific (excluding high income)East Asia & Pacific (IDA & IBRD countries)EcuadorEgypt, Arab Rep.El SalvadorEritreaEthiopiaEurope & Central Asia (excluding high income)Europe & Central Asia (IDA & IBRD countries)FijiFragile and conflict affected situationsGabonGambia, TheGeorgiaGhanaGrenadaGuatemalaGuineaGuinea-BissauGuyanaHaitiHeavily indebted poor countries (HIPC)HondurasIBRD onlyIDA & IBRD totalIDA blendIDA onlyIDA totalIndiaIndonesiaIran, Islamic Rep.IraqJamaicaJordanKazakhstanKenyaKiribatiKorea, Dem. People’s Rep.KosovoKyrgyz RepublicLao PDRLate-demographic dividendLatin America & Caribbean Latin America & Caribbean (excluding high income)Latin America & the Caribbean (IDA & IBRD countries)Least developed countries: UN classificationLebanonLesothoLiberiaLithuaniaLow & middle incomeLow incomeLower middle incomeMacedonia, FYRMadagascarMalawiMalaysiaMaldivesMaliMauritaniaMauritiusMexicoMicronesia, Fed. Sts.Middle East & North Africa (excluding high income)Middle East & North Africa (IDA & IBRD countries)Middle incomeMoldovaMongoliaMontenegroMoroccoMozambiqueMyanmarNamibiaNepalNicaraguaNigerNigeriaOther small statesPacific island small statesPakistanPanamaPapua New GuineaParaguayPeruPhilippinesPre-demographic dividendRomaniaRussian FederationRwandaSamoaSenegalSerbiaSeychellesSierra LeoneSomaliaSouth AfricaSouth AsiaSouth Asia (IDA & IBRD)South SudanSri LankaSt. Kitts and NevisSt. LuciaSt. Vincent and the GrenadinesSub-Saharan Africa Sub-Saharan Africa (excluding high income)Sub-Saharan Africa (IDA & IBRD countries)SudanSurinameSwazilandSyrian Arab RepublicTajikistanTanzaniaThailandTimor-LesteTogoTongaTunisiaTurkeyTurkmenistanUgandaUkraineUpper middle incomeUruguayUzbekistanVanuatuVenezuela, RBVietnamWest Bank and GazaYemen, Rep.ZambiaZimbabwe

La ligne de temps

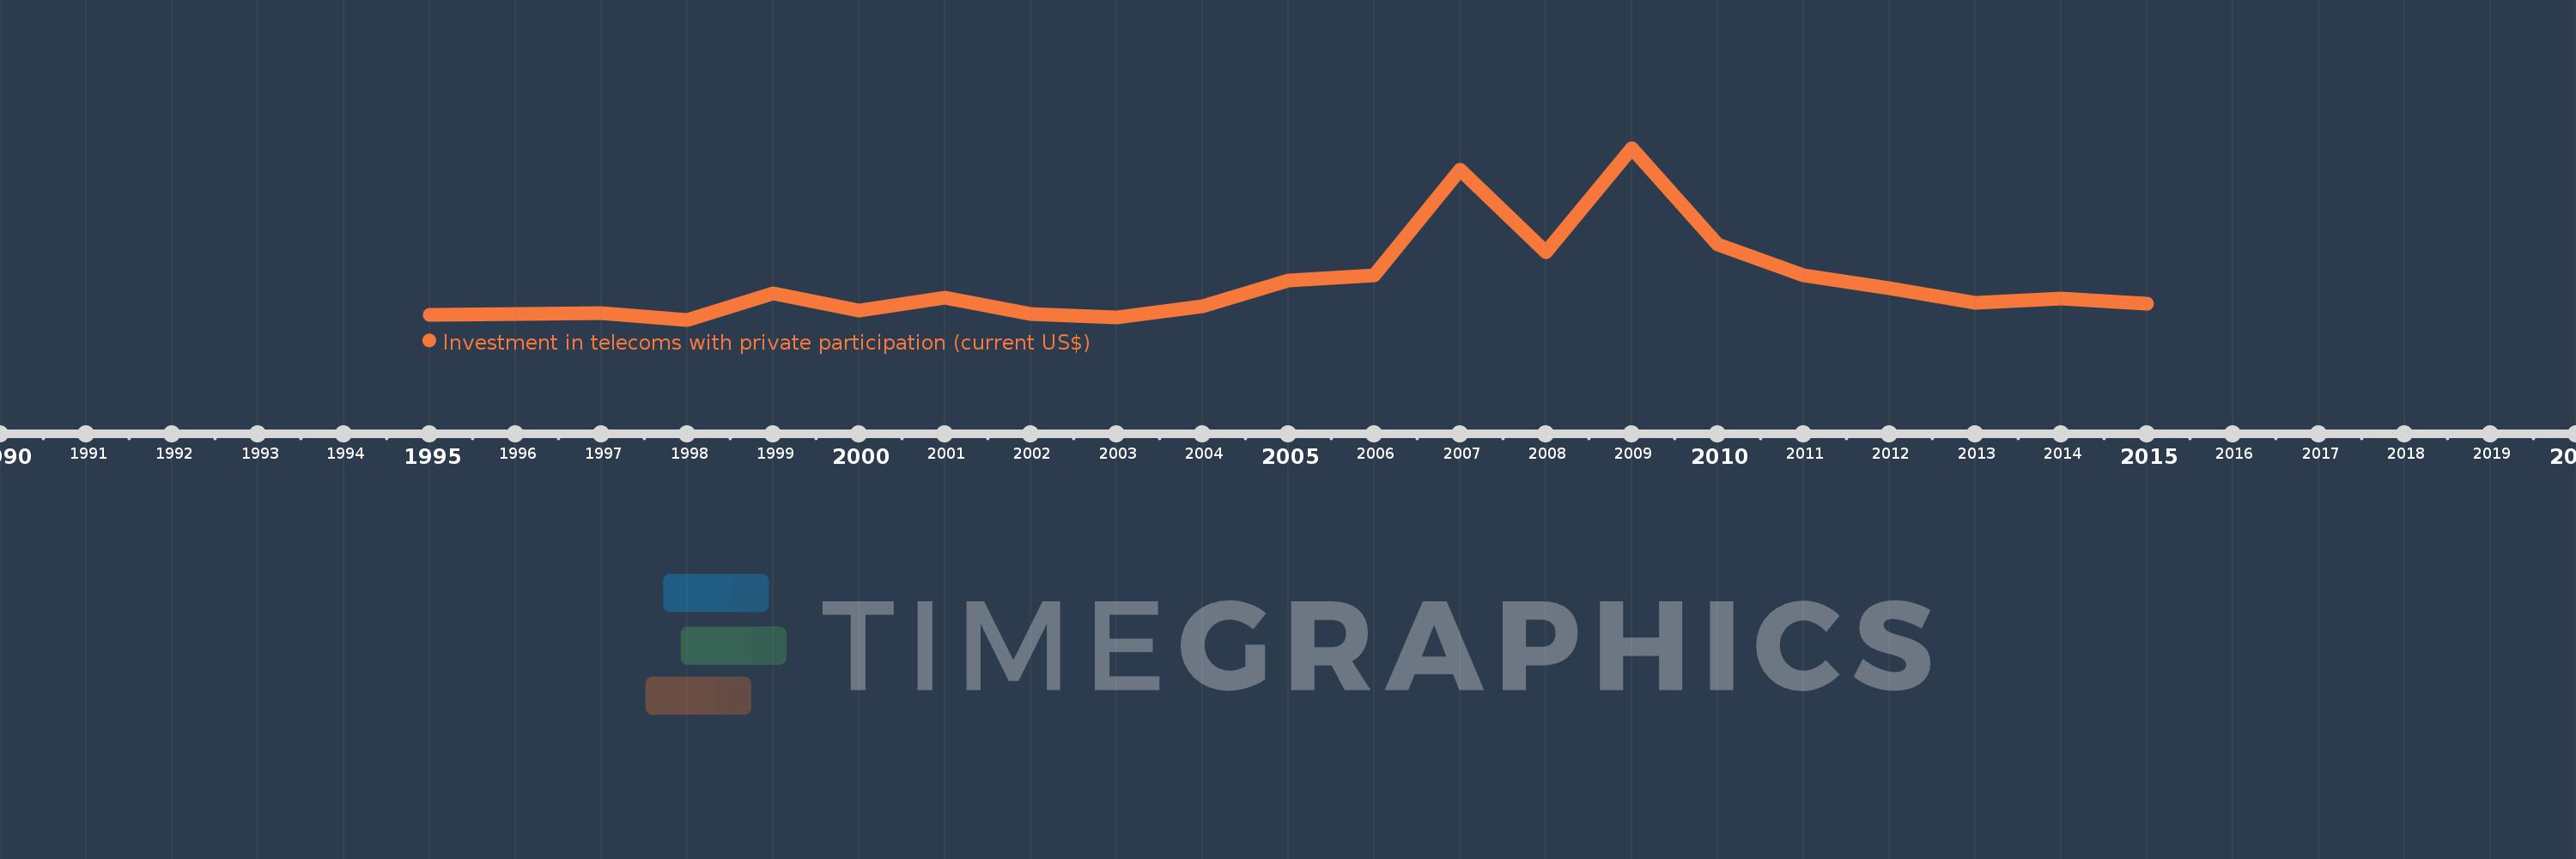
Cette échelle de temps montre un graphique de 1995 année à 2015 année Azerbaijan. Les données jusqu'à 1994 année ne sont pas présentés. Quantité d'observations actuelles selon dates: 20.

Source (désignation):

Les indicateurs du développement mondiale

Source (organisation):

World Bank, Private Participation in Infrastructure Project Database (http://ppi.worldbank.org).

Catégories:

Infrastructure, Private Sector

Dernière mise à jour

23 avr. 2017

Les indicateurs de changement de valeurs selon les années

En moyenne:
106.918 mln.
Minimum:
1000.0 milles
1 janv. 1998
Maximum:
474.0 mln.
1 janv. 2009
Pour la date d''observation
Valeur
Changement absolu
Le changement par rapport à la valeur précédente
1 janv. 1995
14.0 mln.
+14.0 mln.
0.0%
1 janv. 1997
20.0 mln.
+6.0 mln.
42.86%
1 janv. 1998
1000.0 milles
-19.0 mln.
-95.0%
1 janv. 1999
74.0 mln.
+73.0 mln.
7.3 milles%
1 janv. 2000
27.0 mln.
-47.0 mln.
-63.51%
1 janv. 2001
60.6 mln.
+33.6 mln.
124.44%
1 janv. 2002
17.0 mln.
-43.6 mln.
-71.95%
1 janv. 2003
7.0 mln.
-10.0 mln.
-58.82%
1 janv. 2004
39.0 mln.
+32.0 mln.
457.14%
1 janv. 2005
109.0 mln.
+70.0 mln.
179.49%
1 janv. 2006
123.0 mln.
+14.0 mln.
12.84%
1 janv. 2007
413.6 mln.
+290.6 mln.
236.26%
1 janv. 2008
188.0 mln.
-225.6 mln.
-54.55%
1 janv. 2009
474.0 mln.
+286.0 mln.
152.13%
1 janv. 2010
207.9 mln.
-266.1 mln.
-56.14%
1 janv. 2011
124.3 mln.
-83.6 mln.
-40.21%
1 janv. 2012
87.6 mln.
-36.7 mln.
-29.53%
1 janv. 2013
46.5 mln.
-41.1 mln.
-46.92%
1 janv. 2014
60.4 mln.
+13.9 mln.
29.89%
1 janv. 2015
44.46 mln.
-15.94 mln.
-26.39%

Classement des pays selon les statistiques actuelles par années