29
/
en
AIzaSyAYiBZKx7MnpbEhh9jyipgxe19OcubqV5w
April 1, 2024
94274
Bulgaria
BGR
true
2
1
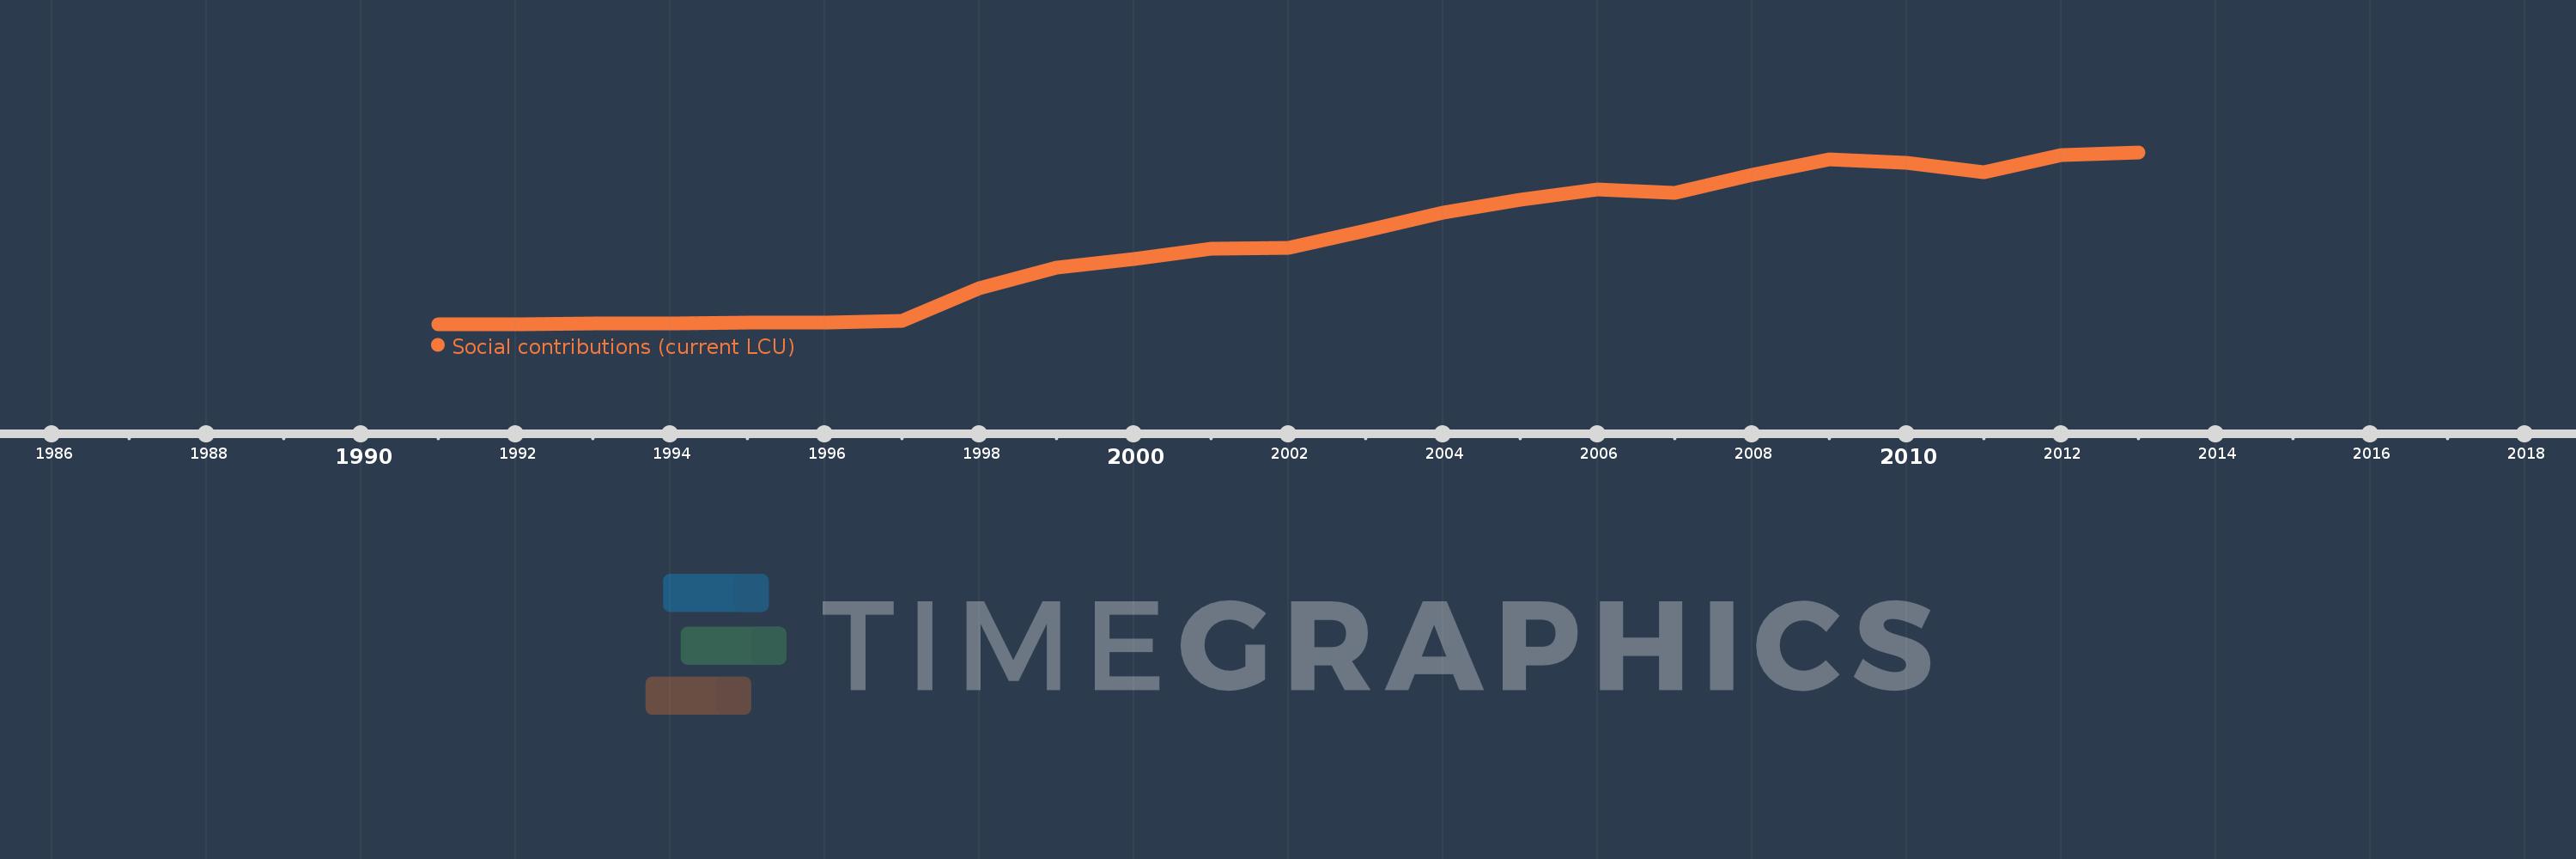
Social contributions (current LCU)
2013,2012,2011,2010,2009,2008,2007,2006,2005,2004,2003,2002,2001,2000,1999,1998,1997,1996,1995,1994,1993,1992,1991
This statistics in other country:
Timeline:
This timeline shows a graph from 1991 to 2013 of Bulgaria. No data until 1990. Number of actual observations by date: 23.
Source name:
World Development Indicators
Source organization:
International Monetary Fund, Government Finance Statistics Yearbook and data files.
Categories, topics:
Public Sector
Last updated:
apr 23, 2017
Indicators value changes by year
Minimum:
4.846 mln
jan 1, 1991
Maximum:
5.623 bln
jan 1, 2013
At the date of observation
Value
Absolute change
Change from previous value
jan 1, 1991
4.846 mln
+4.846 mln
0.0%
jan 1, 1992
11.745 mln
+6.899 mln
142.36%
jan 1, 1993
21.269 mln
+9.524 mln
81.09%
jan 1, 1994
29.68 mln
+8.411 mln
39.55%
jan 1, 1995
45.413 mln
+15.733 mln
53.01%
jan 1, 1996
66.848 mln
+21.435 mln
47.2%
jan 1, 1997
118.224 mln
+51.376 mln
76.85%
jan 1, 1998
1.171 bln
+1.053 bln
890.79%
jan 1, 1999
1.856 bln
+684.955 mln
58.48%
jan 1, 2000
2.132 bln
+275.38 mln
14.83%
jan 1, 2001
2.469 bln
+337.249 mln
15.82%
jan 1, 2002
2.498 bln
+28.92 mln
1.17%
jan 1, 2003
3.075 bln
+577.281 mln
23.11%
jan 1, 2004
3.654 bln
+578.439 mln
18.81%
jan 1, 2005
4.08 bln
+426.597 mln
11.68%
jan 1, 2006
4.41 bln
+329.432 mln
8.07%
jan 1, 2007
4.309 bln
-100.548 mln
-2.28%
jan 1, 2008
4.89 bln
+581.216 mln
13.49%
jan 1, 2009
5.393 bln
+502.368 mln
10.27%
jan 1, 2010
5.273 bln
-119.573 mln
-2.22%
jan 1, 2011
4.97 bln
-303.278 mln
-5.75%
jan 1, 2012
5.533 bln
+562.83 mln
11.33%
jan 1, 2013
5.623 bln
+89.903 mln
1.62%
Ranking of countries by current statistics by years


Comments: