29
/
en
AIzaSyAYiBZKx7MnpbEhh9jyipgxe19OcubqV5w
April 1, 2024
151126
Honduras
HND
true
2
1
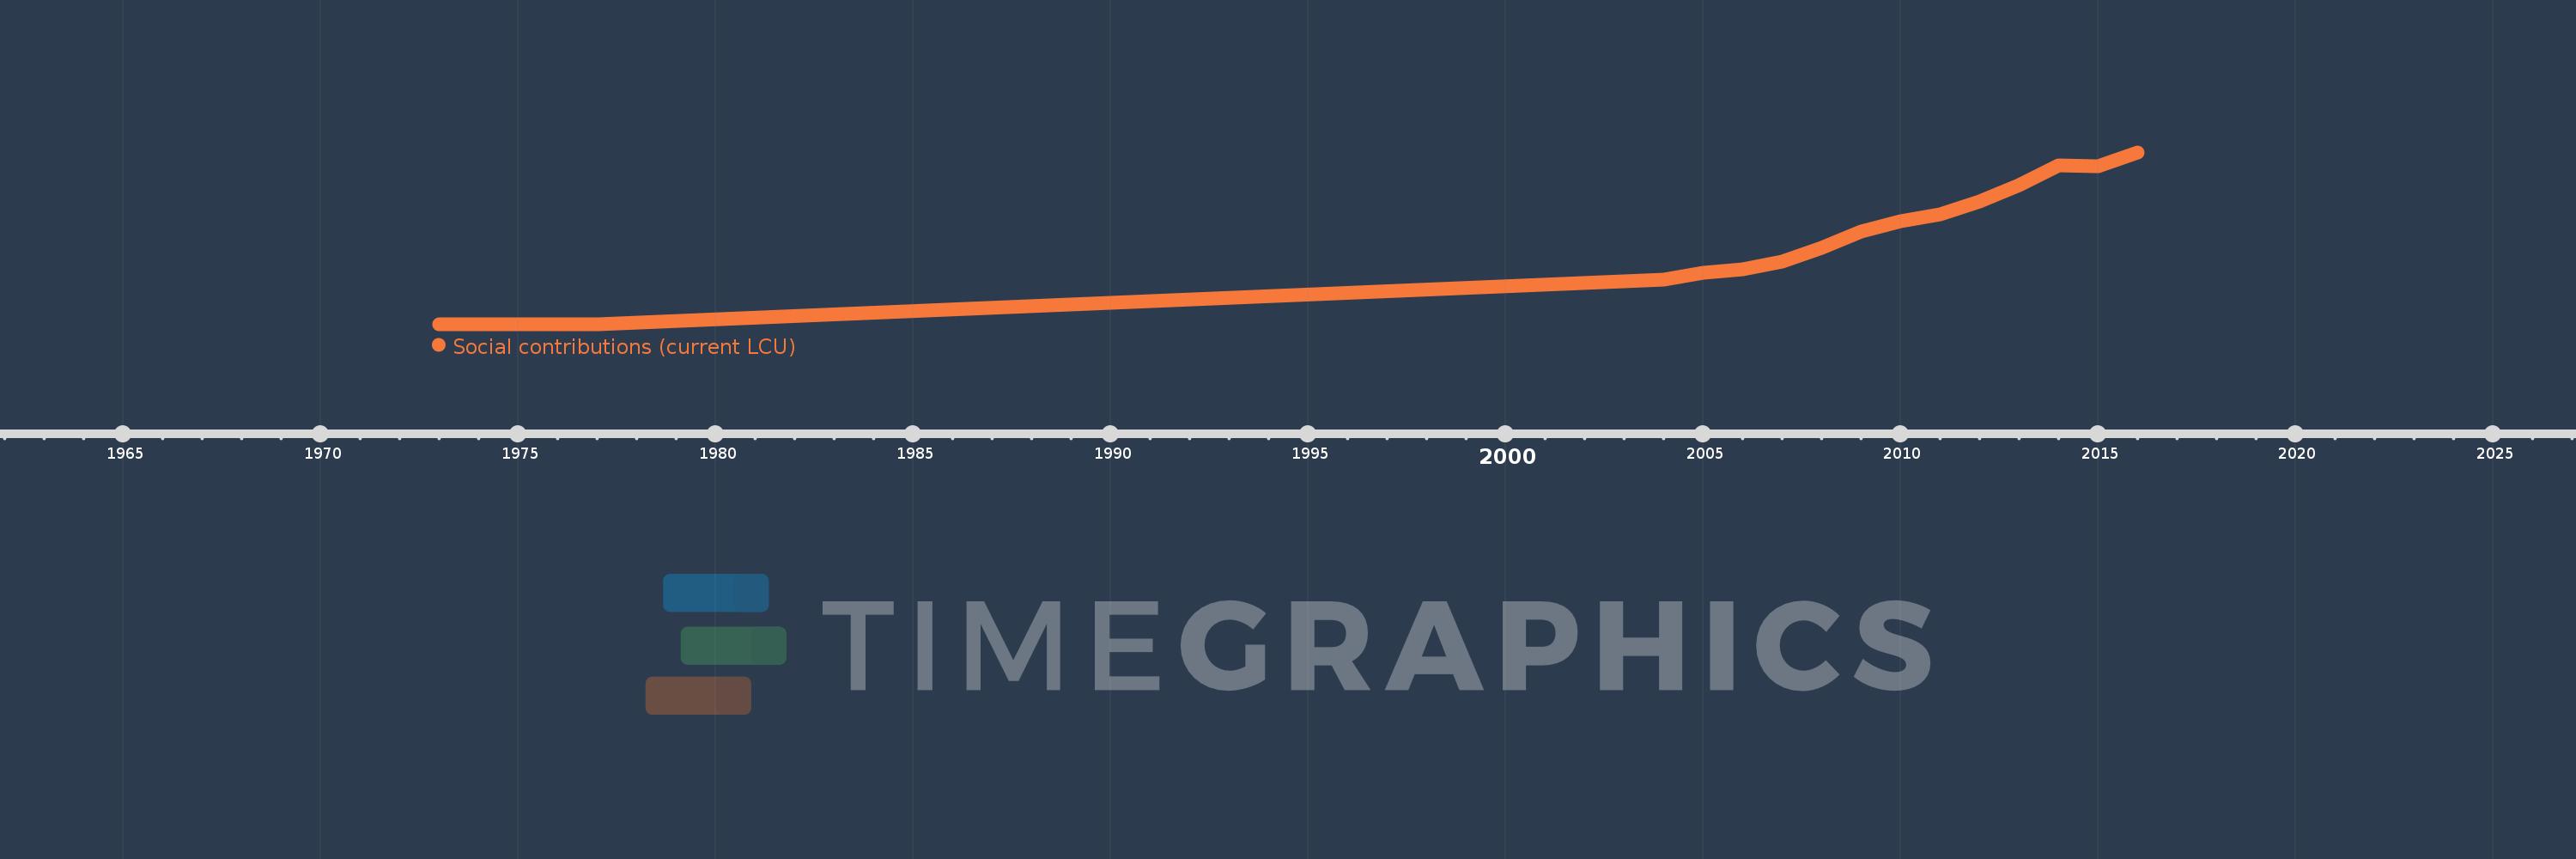
Social contributions (current LCU)
2016,2015,2014,2013,2012,2011,2010,2009,2008,2007,2006,2005,2004,1977,1976,1975,1974,1973
This statistics in other country:
Timeline:
This timeline shows a graph from 1973 to 2016 of Honduras. No data until 1972. Number of actual observations by date: 18.
Source name:
World Development Indicators
Source organization:
International Monetary Fund, Government Finance Statistics Yearbook and data files.
Categories, topics:
Public Sector
Last updated:
apr 23, 2017
Indicators value changes by year
Minimum:
6.1 mln
jan 1, 1973
Maximum:
13.524 bln
jan 1, 2016
At the date of observation
Value
Absolute change
Change from previous value
jan 1, 1973
6.1 mln
+6.1 mln
0.0%
jan 1, 1974
13.0 mln
+6.9 mln
113.11%
jan 1, 1975
18.2 mln
+5.2 mln
40.0%
jan 1, 1976
20.5 mln
+2.3 mln
12.64%
jan 1, 1977
23.3 mln
+2.8 mln
13.66%
jan 1, 2004
3.538 bln
+3.515 bln
15.09K%
jan 1, 2005
4.022 bln
+483.65 mln
13.67%
jan 1, 2006
4.353 bln
+330.75 mln
8.22%
jan 1, 2007
4.958 bln
+605.5 mln
13.91%
jan 1, 2008
6.037 bln
+1.078 bln
21.74%
jan 1, 2009
7.308 bln
+1.271 bln
21.06%
jan 1, 2010
8.122 bln
+814.508 mln
11.15%
jan 1, 2011
8.671 bln
+549.043 mln
6.76%
jan 1, 2012
9.653 bln
+982.324 mln
11.33%
jan 1, 2013
10.934 bln
+1.281 bln
13.27%
jan 1, 2014
12.529 bln
+1.595 bln
14.59%
jan 1, 2015
12.467 bln
-62.205 mln
-0.5%
jan 1, 2016
13.524 bln
+1.057 bln
8.48%
Ranking of countries by current statistics by years


Comments: