29
/
en
AIzaSyAYiBZKx7MnpbEhh9jyipgxe19OcubqV5w
April 1, 2024
96808
Burundi
BDI
true
2
1
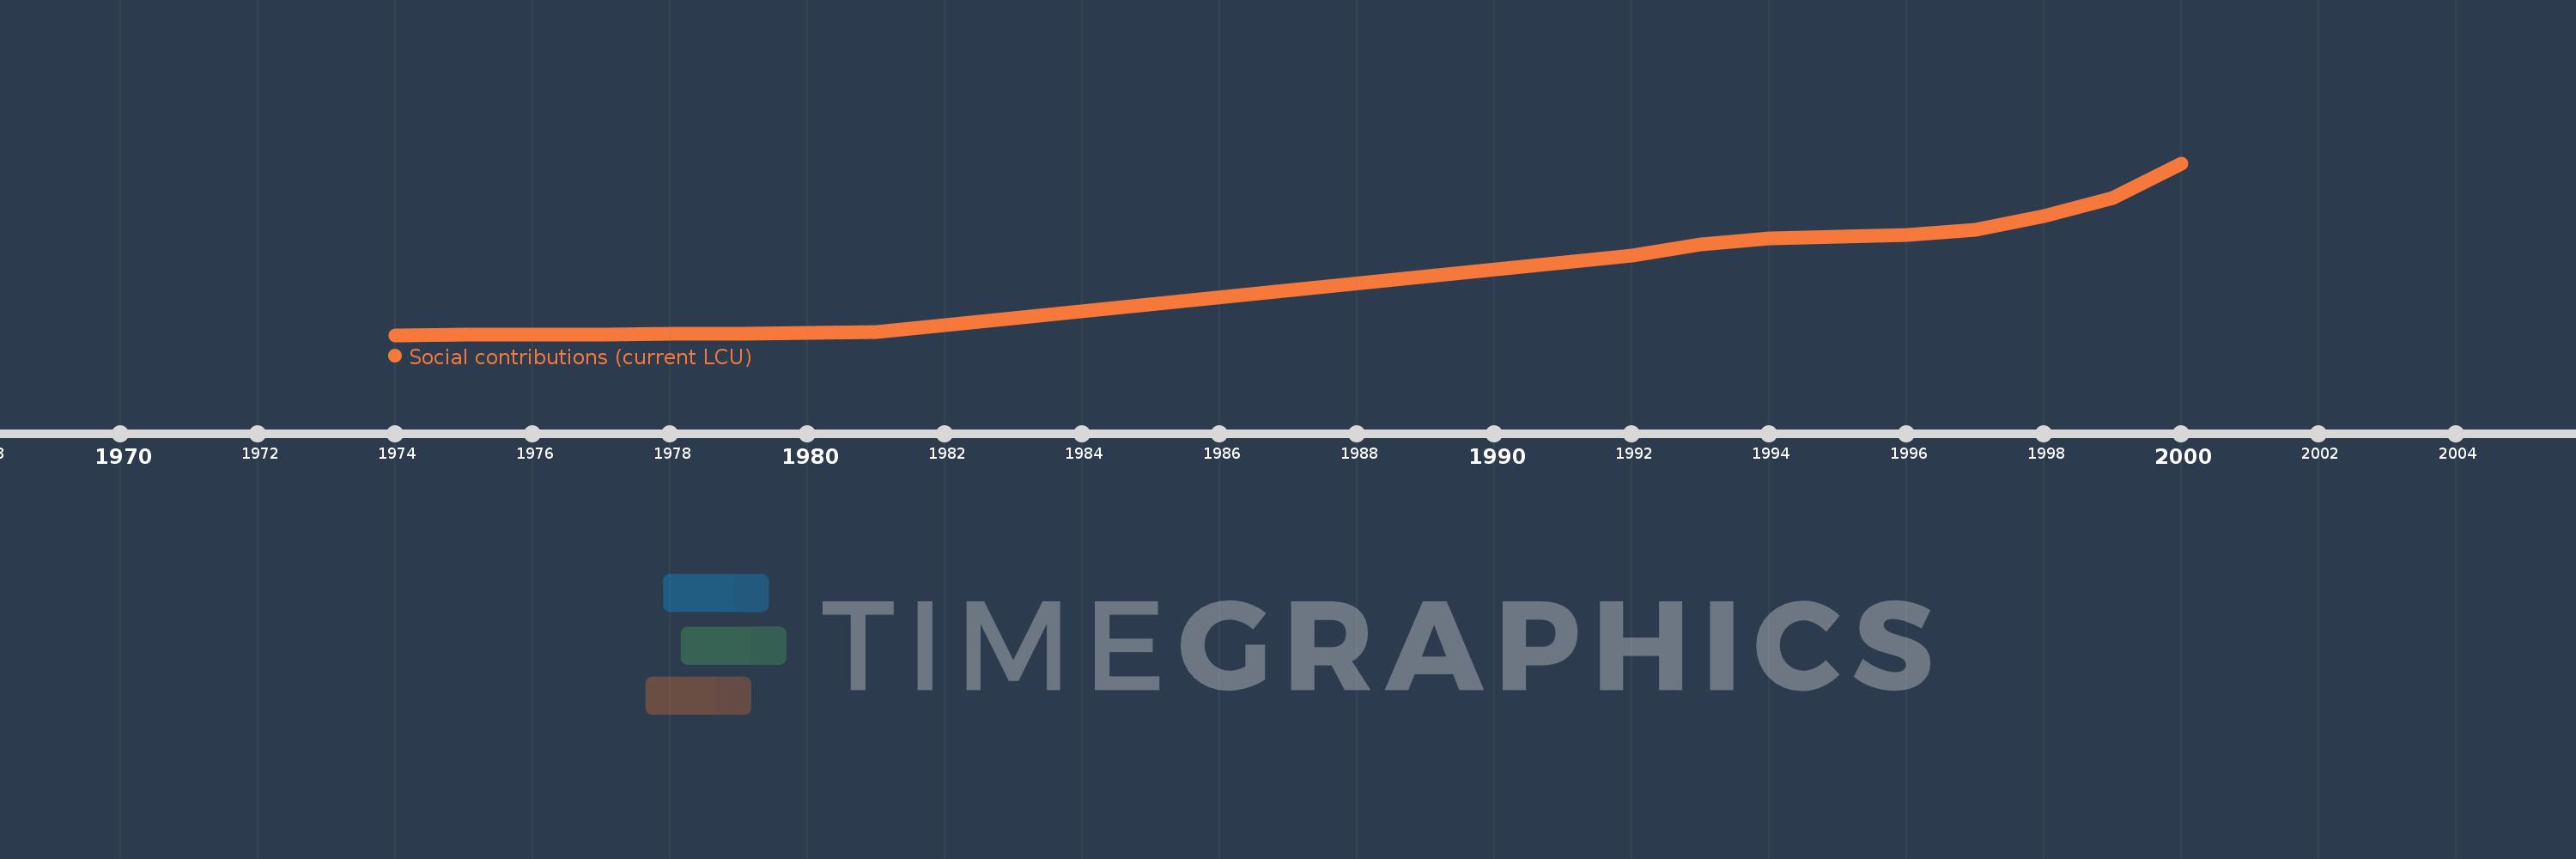
Social contributions (current LCU)
2000,1999,1998,1997,1996,1995,1994,1993,1992,1982,1981,1980,1979,1978,1977,1976,1975,1974
This statistics in other country:
Timeline:
This timeline shows a graph from 1974 to 2000 of Burundi. No data until 1973. Number of actual observations by date: 18.
Source name:
World Development Indicators
Source organization:
International Monetary Fund, Government Finance Statistics Yearbook and data files.
Categories, topics:
Public Sector
Last updated:
apr 23, 2017
Indicators value changes by year
Minimum:
34.0 mln
jan 1, 1974
Maximum:
5.357 bln
jan 1, 2000
At the date of observation
Value
Absolute change
Change from previous value
jan 1, 1974
34.0 mln
+34.0 mln
0.0%
jan 1, 1975
40.0 mln
+6.0 mln
17.65%
jan 1, 1976
49.0 mln
+9.0 mln
22.5%
jan 1, 1977
53.0 mln
+4.0 mln
8.16%
jan 1, 1978
68.0 mln
+15.0 mln
28.3%
jan 1, 1979
87.0 mln
+19.0 mln
27.94%
jan 1, 1980
103.0 mln
+16.0 mln
18.39%
jan 1, 1981
121.0 mln
+18.0 mln
17.48%
jan 1, 1982
336.0 mln
+215.0 mln
177.69%
jan 1, 1992
2.507 bln
+2.171 bln
646.13%
jan 1, 1993
2.855 bln
+348.0 mln
13.88%
jan 1, 1994
3.023 bln
+168.0 mln
5.88%
jan 1, 1995
3.085 bln
+62.0 mln
2.05%
jan 1, 1996
3.143 bln
+58.0 mln
1.88%
jan 1, 1997
3.288 bln
+145.0 mln
4.61%
jan 1, 1998
3.731 bln
+443.0 mln
13.47%
jan 1, 1999
4.281 bln
+550.45 mln
14.75%
jan 1, 2000
5.357 bln
+1.076 bln
25.13%
Ranking of countries by current statistics by years


Comments: