29
/
en
AIzaSyAYiBZKx7MnpbEhh9jyipgxe19OcubqV5w
April 1, 2024
129894
Estonia
EST
true
2
1
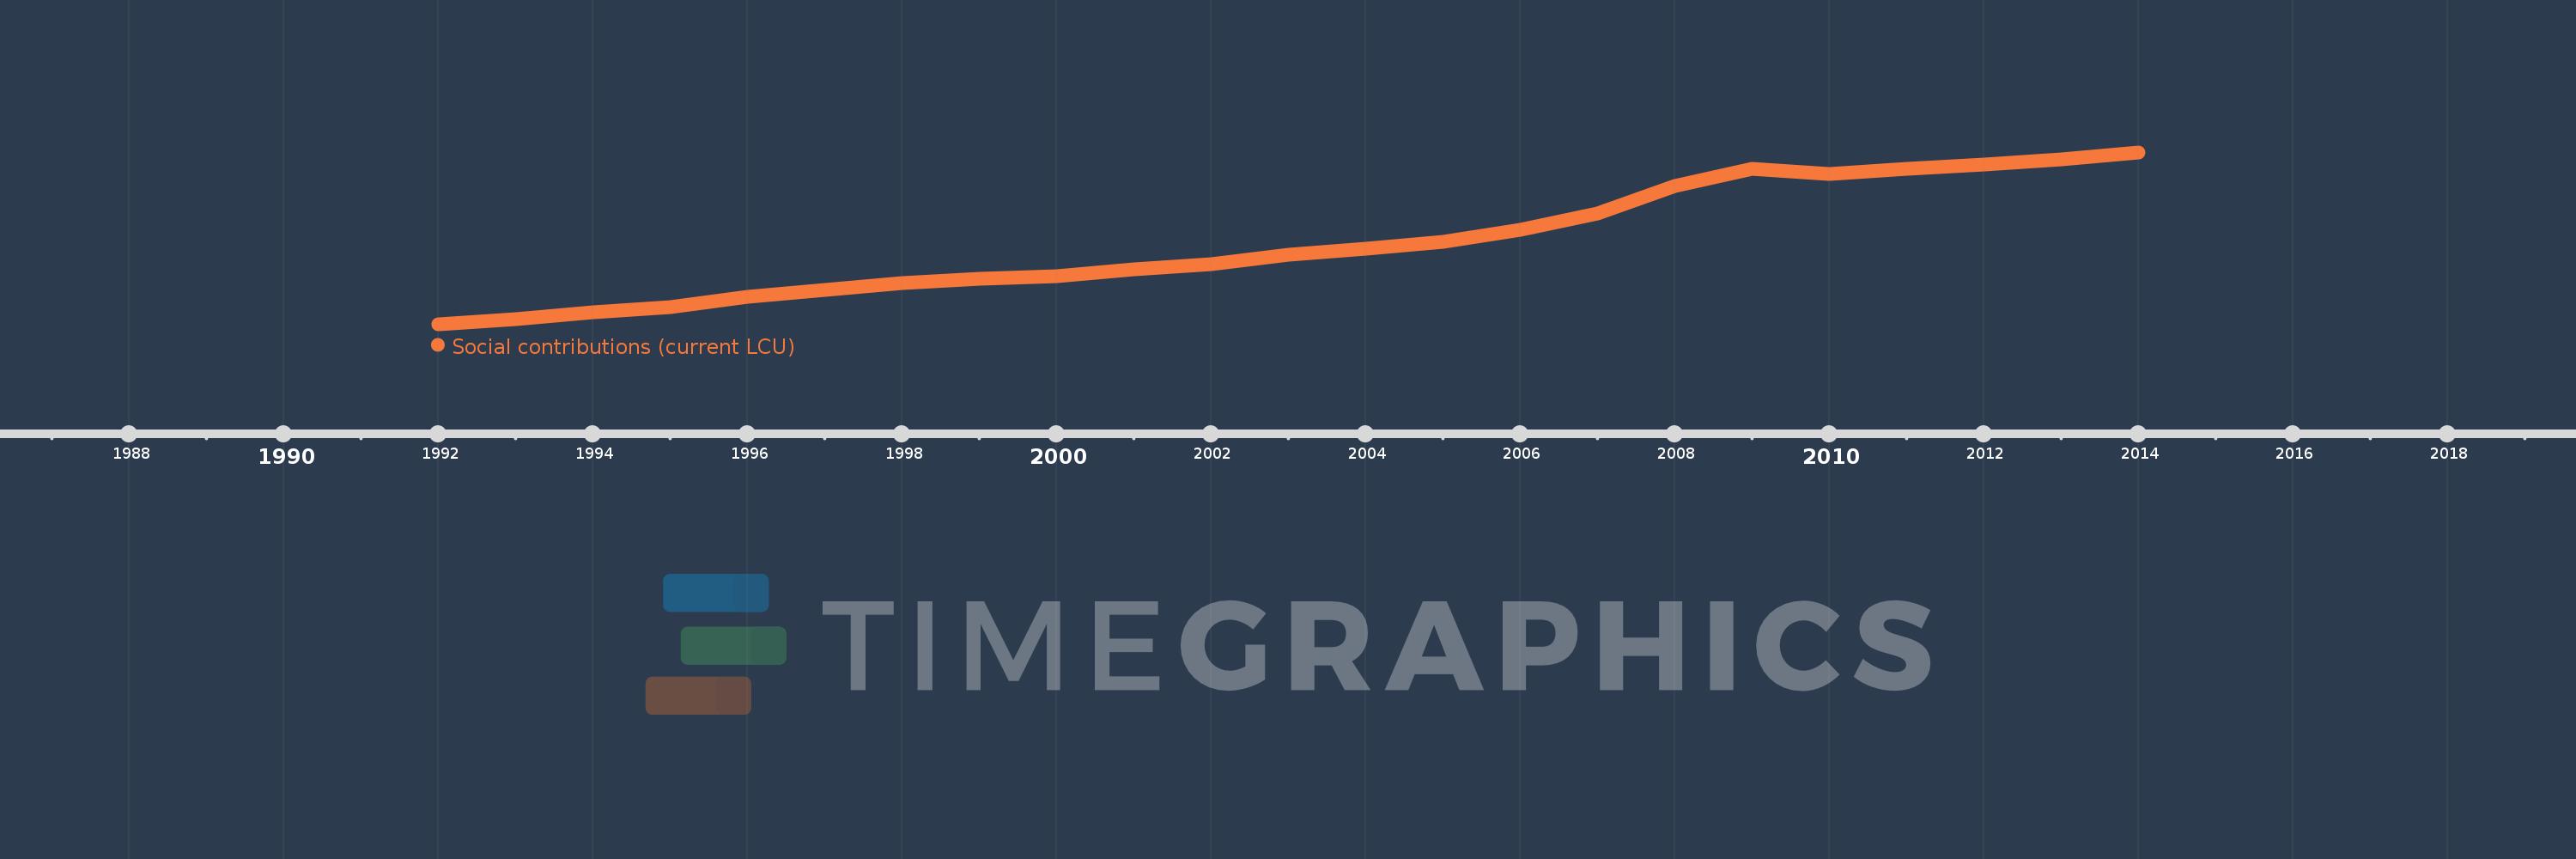
Social contributions (current LCU)
2014,2013,2012,2011,2010,2009,2008,2007,2006,2005,2004,2003,2002,2001,2000,1999,1998,1997,1996,1995,1994,1993,1992
This statistics in other country:
Timeline:
This timeline shows a graph from 1992 to 2014 of Estonia. No data until 1991. Number of actual observations by date: 23.
Source name:
World Development Indicators
Source organization:
International Monetary Fund, Government Finance Statistics Yearbook and data files.
Categories, topics:
Public Sector
Last updated:
apr 23, 2017
Indicators value changes by year
Minimum:
512.221K
jan 1, 1992
Maximum:
134.787 mln
jan 1, 2014
At the date of observation
Value
Absolute change
Change from previous value
jan 1, 1992
512.221K
+512.221K
0.0%
jan 1, 1993
4.458 mln
+3.946 mln
770.41%
jan 1, 1994
9.725 mln
+5.266 mln
118.12%
jan 1, 1995
13.959 mln
+4.234 mln
43.54%
jan 1, 1996
21.736 mln
+7.778 mln
55.72%
jan 1, 1997
27.073 mln
+5.337 mln
24.55%
jan 1, 1998
32.525 mln
+5.452 mln
20.14%
jan 1, 1999
36.059 mln
+3.534 mln
10.87%
jan 1, 2000
38.015 mln
+1.956 mln
5.42%
jan 1, 2001
43.154 mln
+5.14 mln
13.52%
jan 1, 2002
47.66 mln
+4.505 mln
10.44%
jan 1, 2003
54.904 mln
+7.244 mln
15.2%
jan 1, 2004
59.447 mln
+4.543 mln
8.28%
jan 1, 2005
64.637 mln
+5.19 mln
8.73%
jan 1, 2006
73.991 mln
+9.353 mln
14.47%
jan 1, 2007
87.273 mln
+13.283 mln
17.95%
jan 1, 2008
108.602 mln
+21.329 mln
24.44%
jan 1, 2009
122.186 mln
+13.584 mln
12.51%
jan 1, 2010
117.751 mln
-4.435 mln
-3.63%
jan 1, 2011
121.679 mln
+3.927 mln
3.34%
jan 1, 2012
125.307 mln
+3.628 mln
2.98%
jan 1, 2013
129.627 mln
+4.32 mln
3.45%
jan 1, 2014
134.787 mln
+5.16 mln
3.98%
Ranking of countries by current statistics by years


Comments: