29
/
en
AIzaSyAYiBZKx7MnpbEhh9jyipgxe19OcubqV5w
April 1, 2024
82251
Belgium
BEL
true
2
1
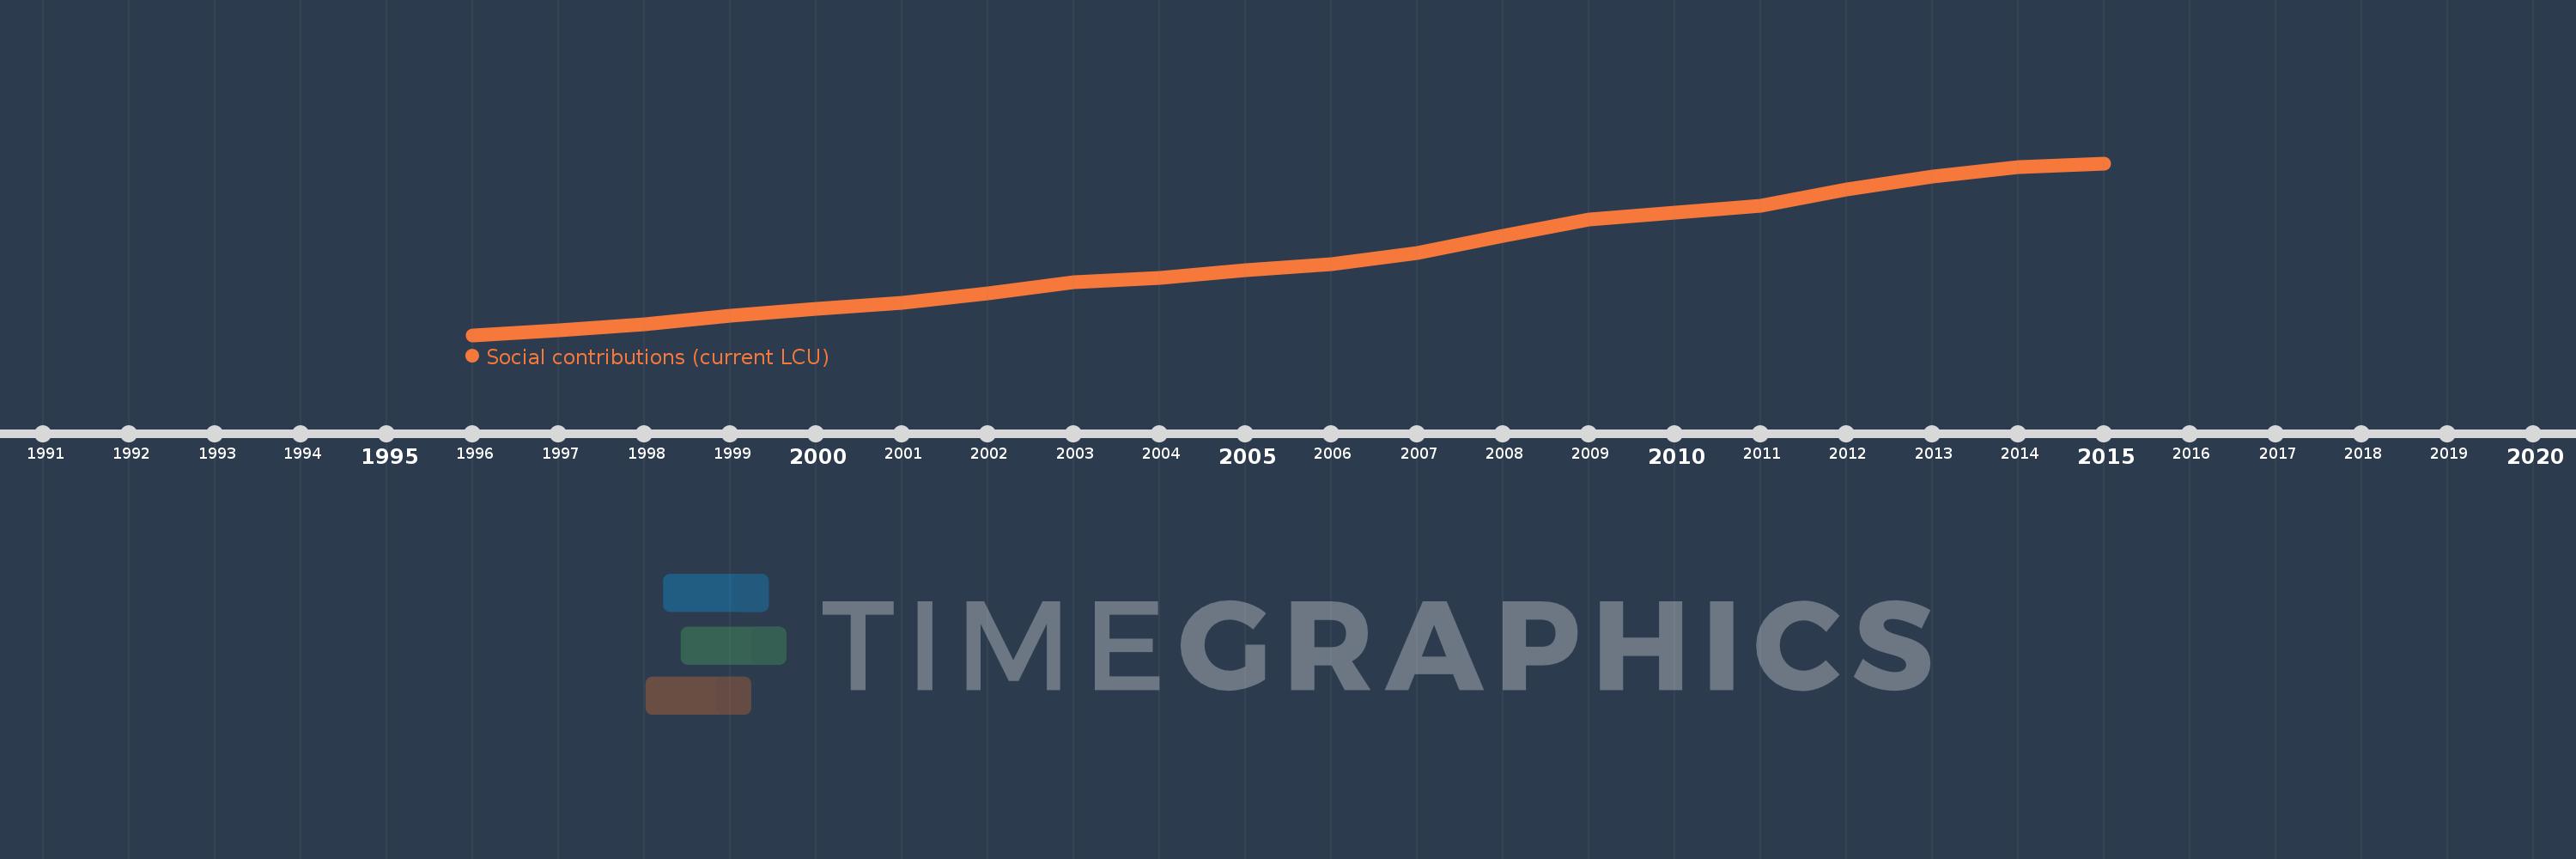
Social contributions (current LCU)
2015,2014,2013,2012,2011,2010,2009,2008,2007,2006,2005,2004,2003,2002,2001,2000,1999,1998,1997,1996
This statistics in other country:
Timeline:
This timeline shows a graph from 1996 to 2015 of Belgium. No data until 1995. Number of actual observations by date: 20.
Source name:
World Development Indicators
Source organization:
International Monetary Fund, Government Finance Statistics Yearbook and data files.
Categories, topics:
Public Sector
Last updated:
apr 23, 2017
Indicators value changes by year
Minimum:
31.148 bln
jan 1, 1996
Maximum:
59.595 bln
jan 1, 2015
At the date of observation
Value
Absolute change
Change from previous value
jan 1, 1996
31.148 bln
+31.148 bln
0.0%
jan 1, 1997
31.868 bln
+719.7 mln
2.31%
jan 1, 1998
32.971 bln
+1.103 bln
3.46%
jan 1, 1999
34.312 bln
+1.341 bln
4.07%
jan 1, 2000
35.529 bln
+1.217 bln
3.55%
jan 1, 2001
36.476 bln
+947.1 mln
2.67%
jan 1, 2002
38.023 bln
+1.547 bln
4.24%
jan 1, 2003
39.88 bln
+1.857 bln
4.88%
jan 1, 2004
40.637 bln
+757.2 mln
1.9%
jan 1, 2005
41.858 bln
+1.221 bln
3.0%
jan 1, 2006
42.94 bln
+1.082 bln
2.59%
jan 1, 2007
44.744 bln
+1.804 bln
4.2%
jan 1, 2008
47.528 bln
+2.785 bln
6.22%
jan 1, 2009
50.258 bln
+2.73 bln
5.74%
jan 1, 2010
51.371 bln
+1.113 bln
2.21%
jan 1, 2011
52.542 bln
+1.171 bln
2.28%
jan 1, 2012
55.212 bln
+2.669 bln
5.08%
jan 1, 2013
57.422 bln
+2.21 bln
4.0%
jan 1, 2014
59.0 bln
+1.578 bln
2.75%
jan 1, 2015
59.595 bln
+594.7 mln
1.01%
Ranking of countries by current statistics by years


Comments: