29
/
en
AIzaSyAYiBZKx7MnpbEhh9jyipgxe19OcubqV5w
April 1, 2024
68419
Angola
AGO
true
2
1
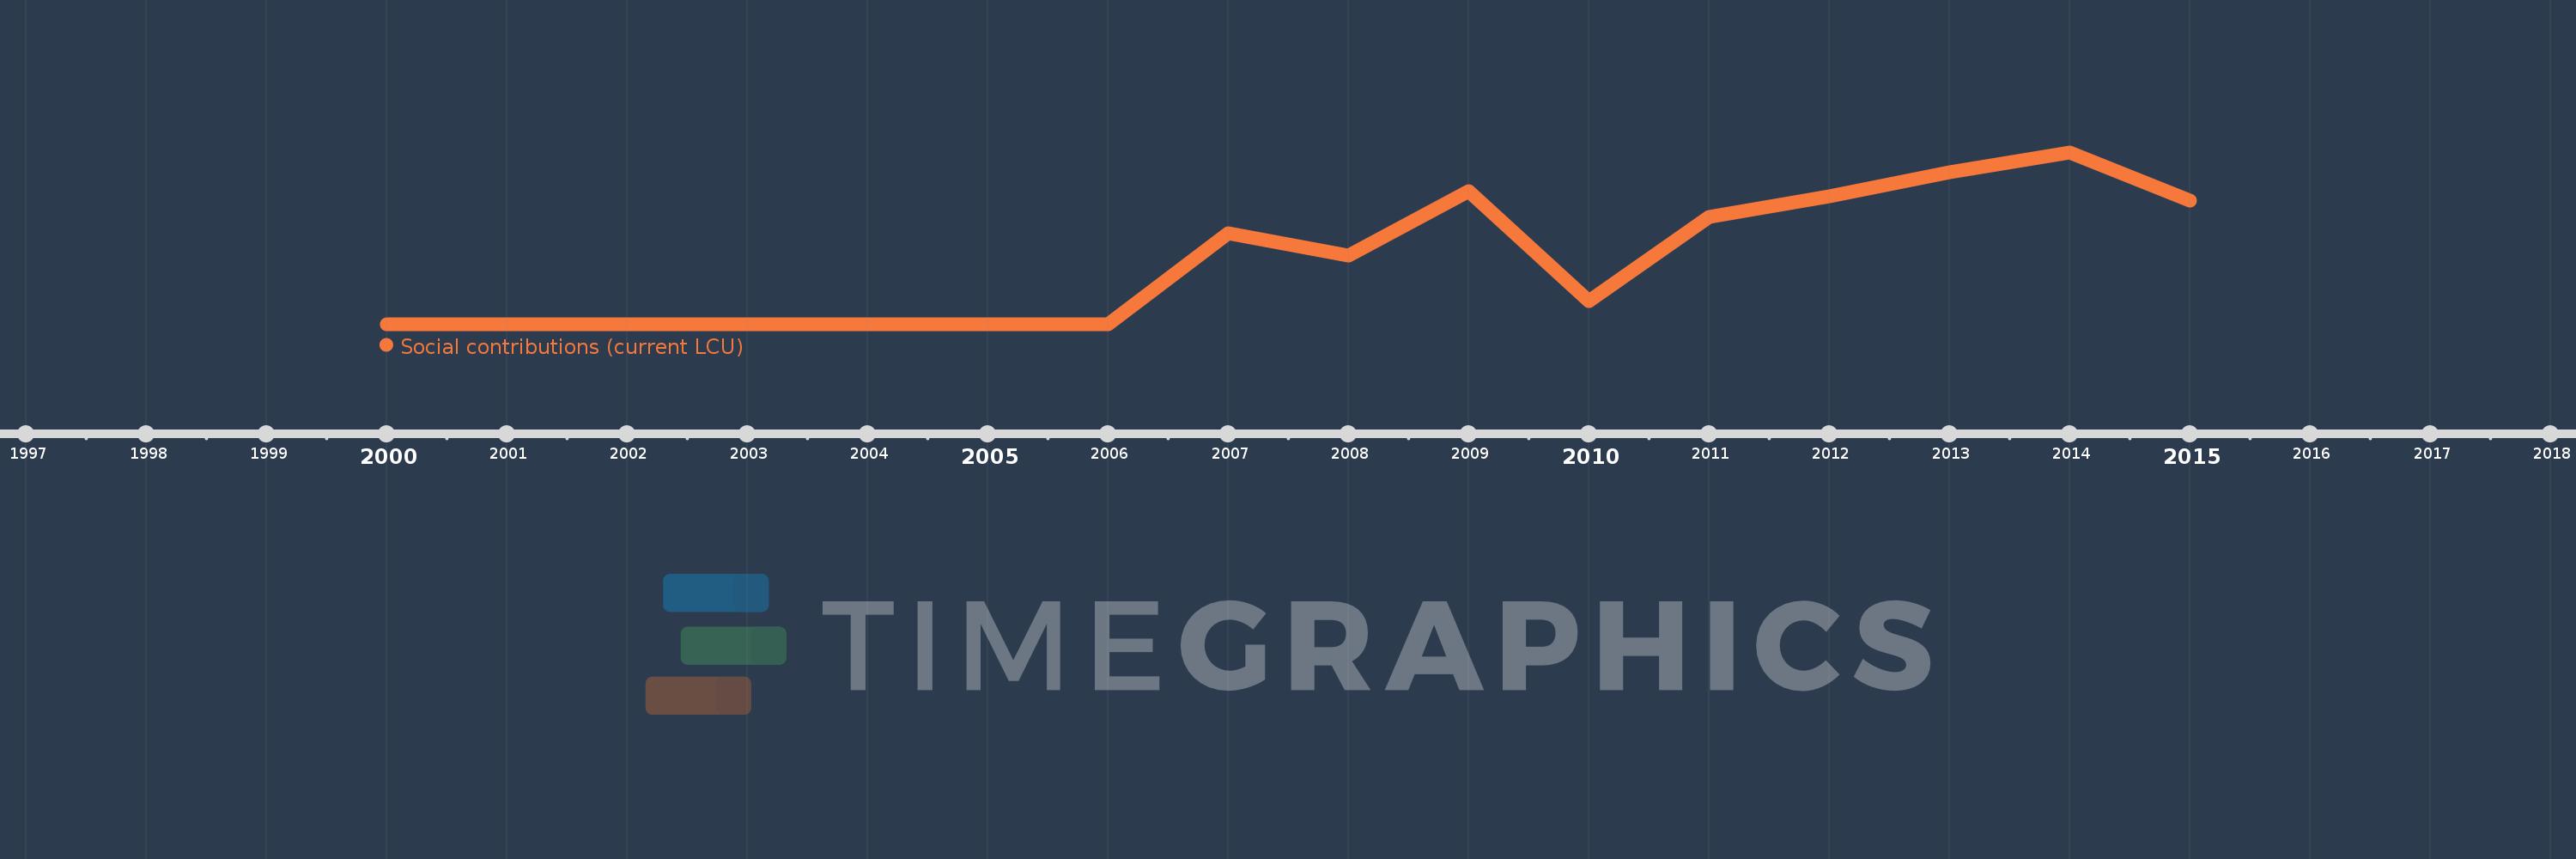
Social contributions (current LCU)
2015,2014,2013,2012,2011,2010,2009,2008,2007,2006,2004,2003,2002,2001,2000
This statistics in other country:
Timeline:
This timeline shows a graph from 2000 to 2015 of Angola. No data until 1999. Number of actual observations by date: 15.
Source name:
World Development Indicators
Source organization:
International Monetary Fund, Government Finance Statistics Yearbook and data files.
Categories, topics:
Public Sector
Last updated:
apr 23, 2017
Indicators value changes by year
Maximum:
120.72 bln
jan 1, 2014
At the date of observation
Value
Absolute change
Change from previous value
jan 1, 2000
1.215K
+1.215K
0.0%
jan 1, 2001
909.0
-305.983
-25.18%
jan 1, 2002
4.778K
+3.869K
425.63%
jan 1, 2003
46.81 mln
+46.806 mln
979.61K%
jan 1, 2004
46.158 mln
-652.591K
-1.39%
jan 1, 2006
24.55 mln
-21.608 mln
-46.81%
jan 1, 2007
63.666 bln
+63.641 bln
259.23K%
jan 1, 2008
48.195 bln
-15.471 bln
-24.3%
jan 1, 2009
93.398 bln
+45.203 bln
93.79%
jan 1, 2010
16.078 bln
-77.321 bln
-82.79%
jan 1, 2011
75.611 bln
+59.533 bln
370.29%
jan 1, 2012
89.776 bln
+14.165 bln
18.73%
jan 1, 2013
106.582 bln
+16.806 bln
18.72%
jan 1, 2014
120.72 bln
+14.138 bln
13.26%
jan 1, 2015
86.856 bln
-33.864 bln
-28.05%
Ranking of countries by current statistics by years


Comments: