29
/
en
AIzaSyAYiBZKx7MnpbEhh9jyipgxe19OcubqV5w
April 1, 2024
233247
San Marino
SMR
true
2
1
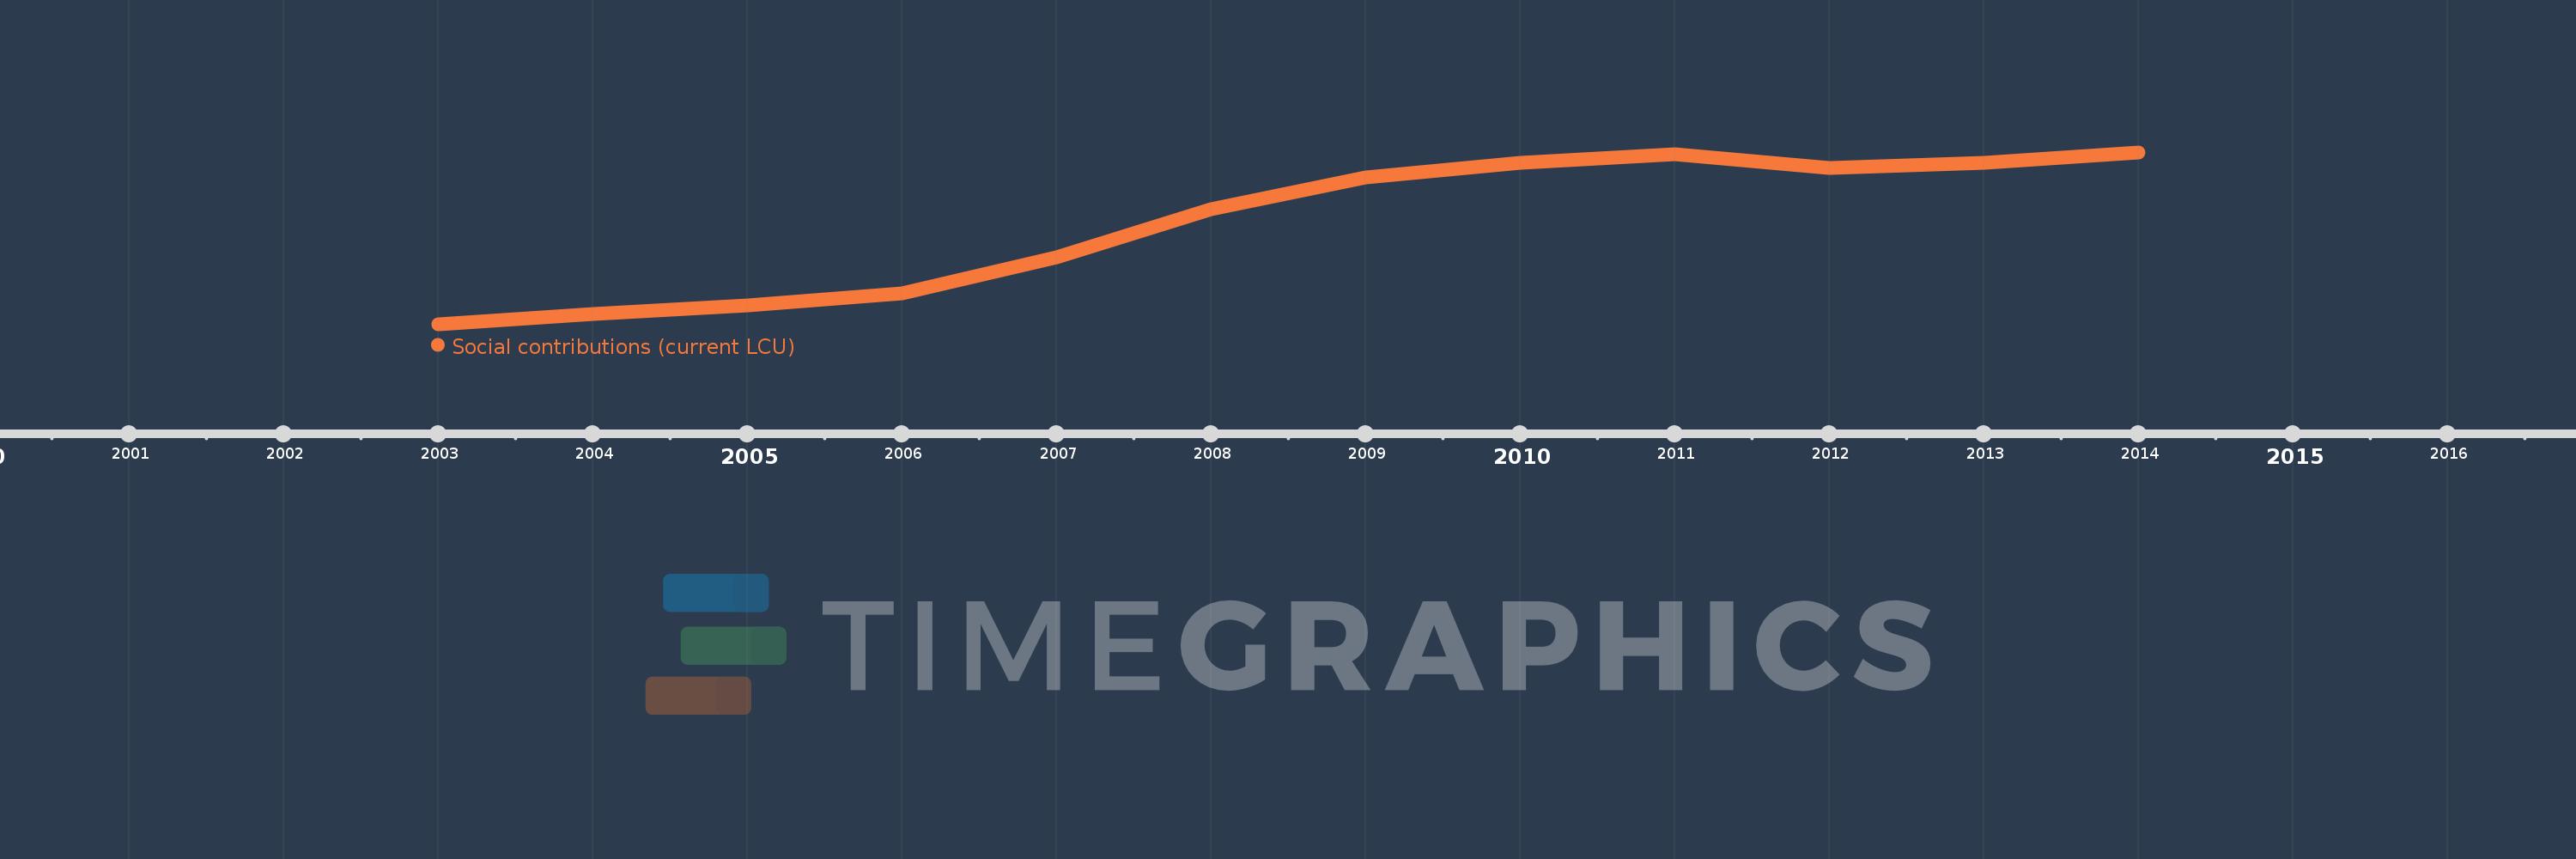
Social contributions (current LCU)
2014,2013,2012,2011,2010,2009,2008,2007,2006,2005,2004,2003
This statistics in other country:
Timeline:
This timeline shows a graph from 2003 to 2014 of San Marino. No data until 2002. Number of actual observations by date: 12.
Source name:
World Development Indicators
Source organization:
International Monetary Fund, Government Finance Statistics Yearbook and data files.
Categories, topics:
Public Sector
Last updated:
apr 23, 2017
Indicators value changes by year
Minimum:
94.358 mln
jan 1, 2003
Maximum:
168.295 mln
jan 1, 2014
At the date of observation
Value
Absolute change
Change from previous value
jan 1, 2003
94.358 mln
+94.358 mln
0.0%
jan 1, 2004
98.729 mln
+4.371 mln
4.63%
jan 1, 2005
102.57 mln
+3.842 mln
3.89%
jan 1, 2006
107.613 mln
+5.042 mln
4.92%
jan 1, 2007
123.222 mln
+15.61 mln
14.51%
jan 1, 2008
143.696 mln
+20.473 mln
16.61%
jan 1, 2009
157.552 mln
+13.856 mln
9.64%
jan 1, 2010
163.711 mln
+6.16 mln
3.91%
jan 1, 2011
167.666 mln
+3.954 mln
2.42%
jan 1, 2012
161.658 mln
-6.007 mln
-3.58%
jan 1, 2013
163.975 mln
+2.316 mln
1.43%
jan 1, 2014
168.295 mln
+4.32 mln
2.63%
Ranking of countries by current statistics by years


Comments: