30
/
AIzaSyAYiBZKx7MnpbEhh9jyipgxe19OcubqV5w
April 1, 2024
199877
Mongolia
MNG
true
2
1
Social contributions (current LCU)
2014,2013,2012,2011,2010,2009,2008,2007,2004,2003,2002,2001,2000,1999,1998,1997,1996,1995,1994,1993
Public Timelines
FAQ
Menu
Public Timelines
FAQ
Public Timelines
FAQ
For education
For educational institutions
For teachers
For students
Open cabinet
For educational institutions
For teachers
For students
Open cabinet
Create
Close
Create a timeline
Public timelines
Library
FAQ
Download
Global statistics library
→
Mongolia
→
Social contributions (current LCU)
This statistics in other country:
Afghanistan
Albania
Angola
Argentina
Armenia
Australia
Austria
Azerbaijan
Barbados
Belarus
Belgium
Belize
Benin
Bhutan
Bolivia
Bosnia and Herzegovina
Brazil
Bulgaria
Burundi
Cabo Verde
Canada
Central African Republic
Chile
China
Colombia
Congo, Rep.
Costa Rica
Cote d'Ivoire
Croatia
Cyprus
Czech Republic
Denmark
Dominican Republic
Egypt, Arab Rep.
El Salvador
Estonia
Ethiopia
Fiji
Finland
France
Gambia, The
Georgia
Germany
Ghana
Greece
Grenada
Guatemala
Honduras
Hong Kong SAR, China
Hungary
Iceland
India
Indonesia
Iran, Islamic Rep.
Iraq
Ireland
Israel
Italy
Jamaica
Japan
Jordan
Kazakhstan
Kenya
Korea, Rep.
Latvia
Lebanon
Liberia
Lithuania
Luxembourg
Macao SAR, China
Macedonia, FYR
Madagascar
Malta
Mauritius
Mexico
Moldova
Mongolia
Morocco
Mozambique
Namibia
Netherlands
New Zealand
Norway
Panama
Papua New Guinea
Paraguay
Peru
Poland
Portugal
Romania
Russian Federation
San Marino
Sao Tome and Principe
Serbia
Seychelles
Slovak Republic
Slovenia
South Africa
Spain
Sri Lanka
St. Kitts and Nevis
Sweden
Switzerland
Syrian Arab Republic
Tajikistan
Thailand
Trinidad and Tobago
Tunisia
Turkey
Ukraine
United Arab Emirates
United Kingdom
United States
Uruguay
Venezuela, RB
Zambia
Zimbabwe
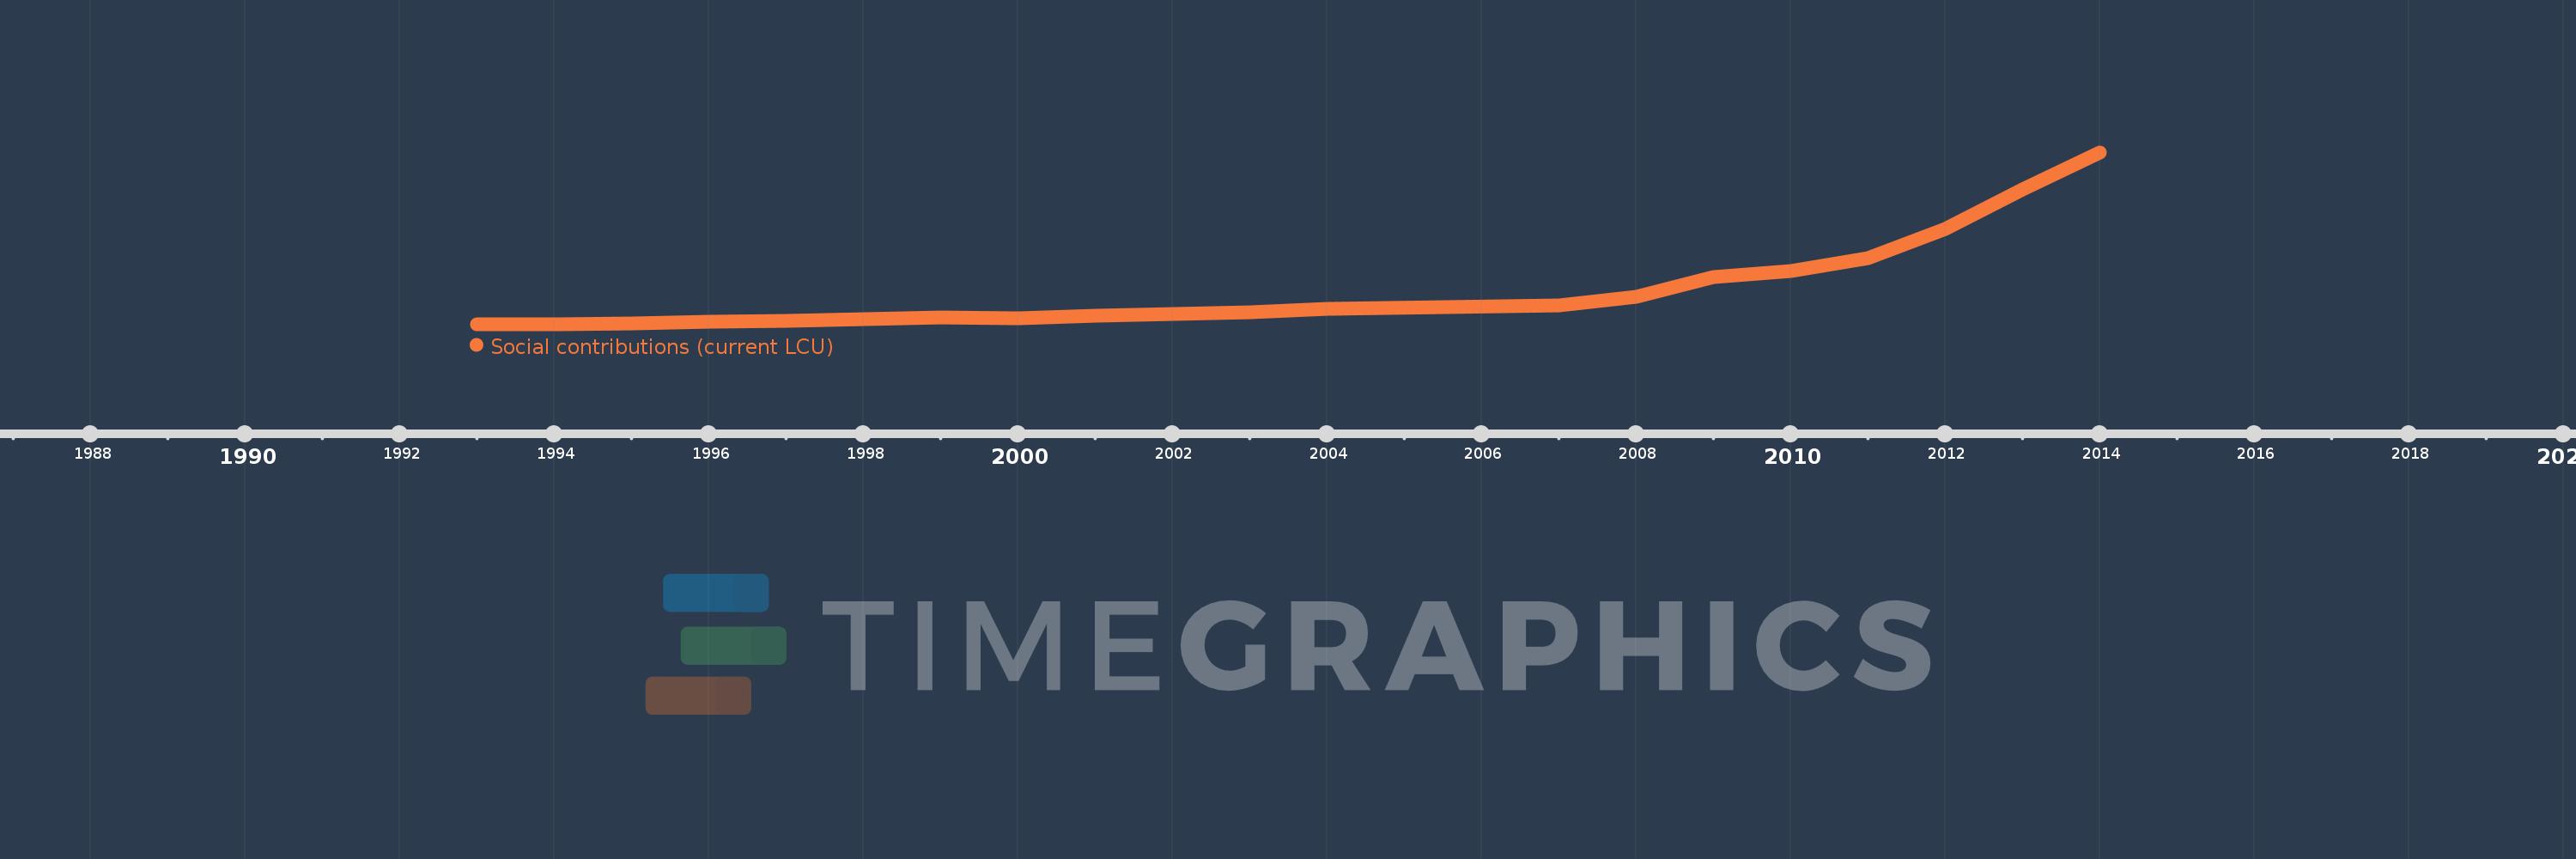
Timeline:
This timeline shows a graph from
1993
to
2014
of Mongolia. No data until
1992
. Number of actual observations by date:
20
.
Source name:
World Development Indicators
Source organization:
International Monetary Fund, Government Finance Statistics Yearbook and data files.
Categories, topics:
Public Sector
Last updated:
apr 23, 2017
Indicators value changes by year
Meaning:
204.001 bln
Minimum:
1.176 bln
jan 1, 1993
Maximum:
1.019 trl
jan 1, 2014
At the date of observation
Value
Absolute change
Change from the previous value
jan 1, 1993
1.176 bln
+1.176 bln
0.0%
jan 1, 1994
2.588 bln
+1.412 bln
120.07%
jan 1, 1995
6.212 bln
+3.624 bln
140.03%
jan 1, 1996
16.039 bln
+9.827 bln
158.19%
jan 1, 1997
20.659 bln
+4.62 bln
28.8%
jan 1, 1998
30.352 bln
+9.693 bln
46.92%
jan 1, 1999
38.98 bln
+8.628 bln
28.43%
jan 1, 2000
38.456 bln
-524.0 mln
-1.34%
jan 1, 2001
53.942 bln
+15.486 bln
40.27%
jan 1, 2002
61.306 bln
+7.364 bln
13.65%
jan 1, 2003
69.918 bln
+8.612 bln
14.05%
jan 1, 2004
90.844 bln
+20.926 bln
29.93%
jan 1, 2007
111.933 bln
+21.089 bln
23.22%
jan 1, 2008
165.842 bln
+53.909 bln
48.16%
jan 1, 2009
278.565 bln
+112.722 bln
67.97%
jan 1, 2010
315.795 bln
+37.23 bln
13.37%
jan 1, 2011
394.31 bln
+78.515 bln
24.86%
jan 1, 2012
565.069 bln
+170.759 bln
43.31%
jan 1, 2013
799.222 bln
+234.153 bln
41.44%
jan 1, 2014
1.019 trl
+219.588 bln
27.48%
Ranking of countries by current statistics by years
About & Feedback
Terms
Privacy
Library
2024
©
Time.Graphics
Support 24/7
Cabinet
Get premium
Donate
The service accepts bank transfer (ACH, Wire) or cards (Visa, MasterCard, etc). Processed by Stripe.
Secured with SSL
Excellent (Trustpilot Reviews)
Based on 115+ reviews
Write your own review on
Trustpilot.com
