29
/
en
AIzaSyAYiBZKx7MnpbEhh9jyipgxe19OcubqV5w
April 1, 2024
84793
Benin
BEN
true
2
1
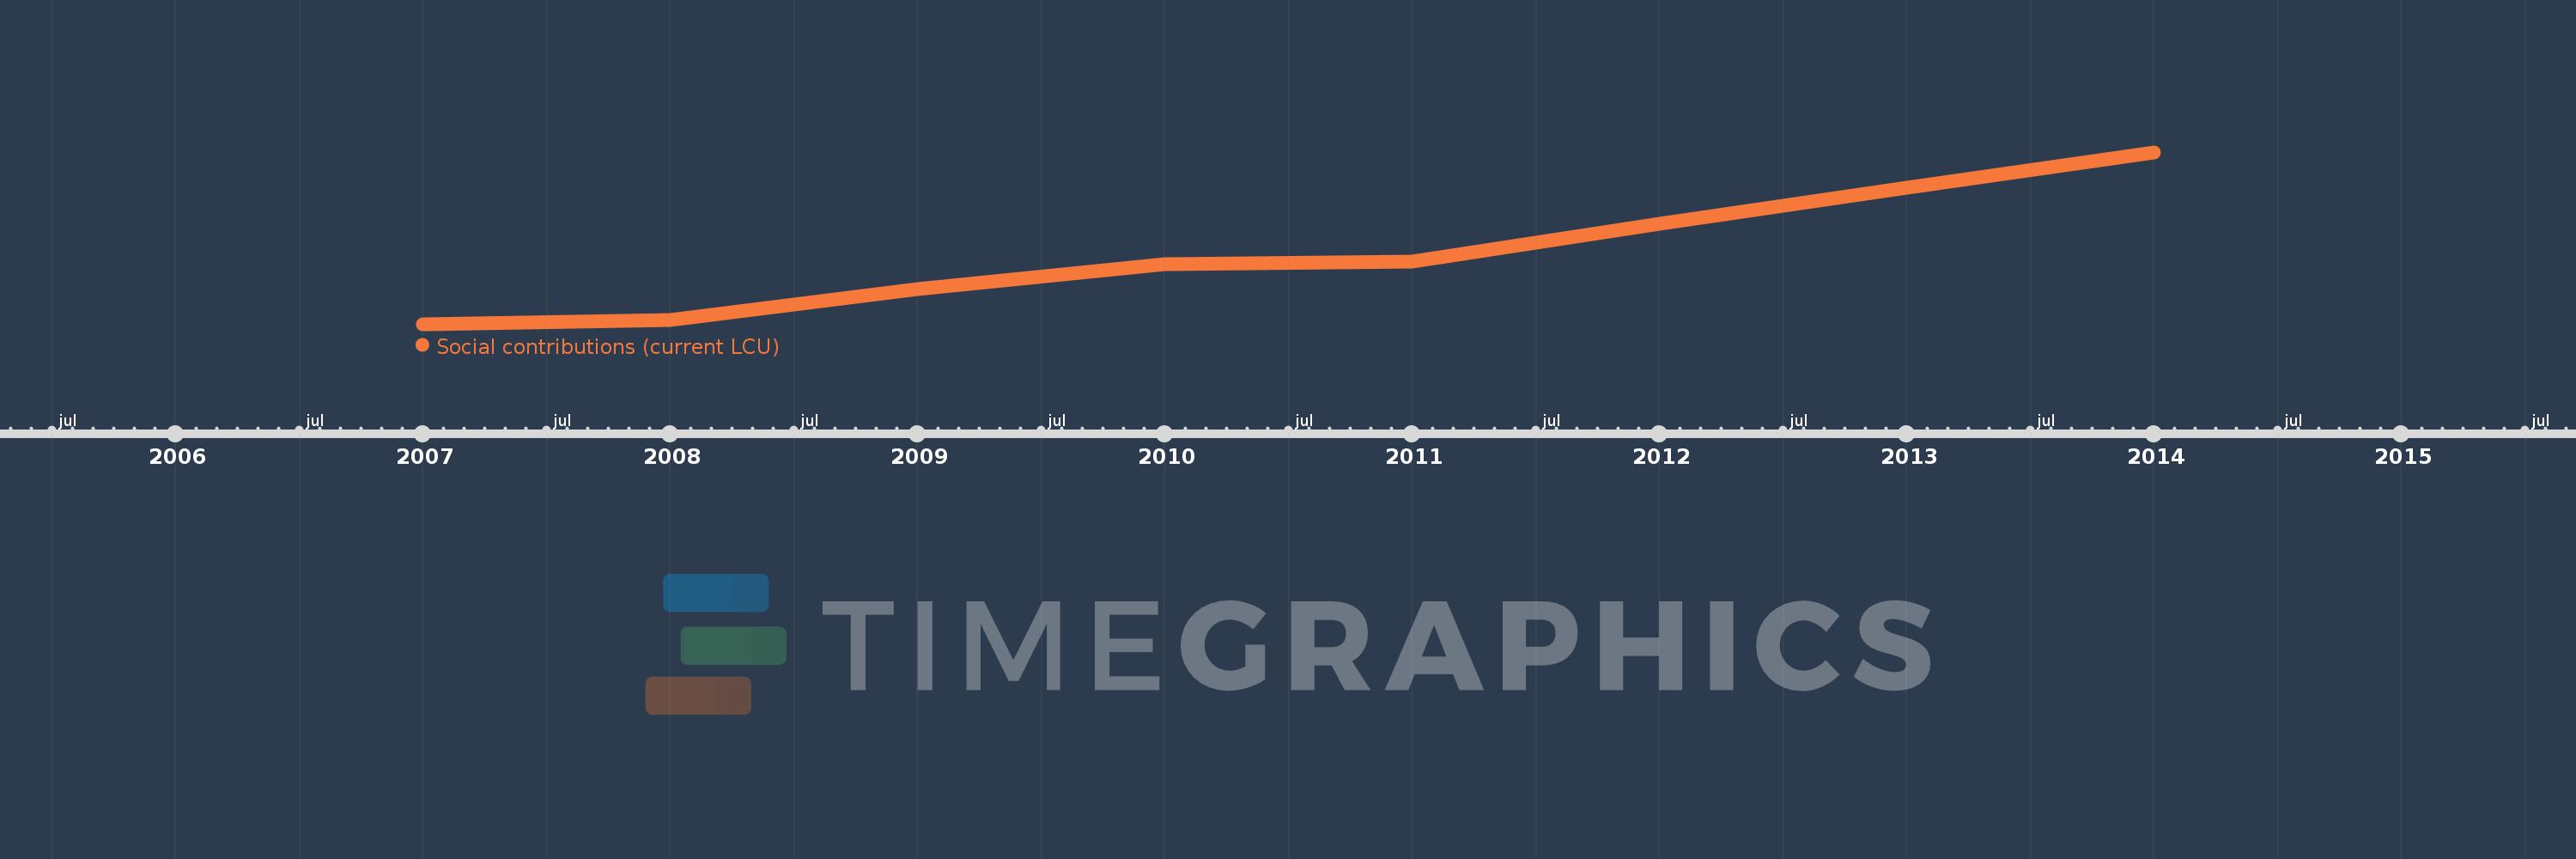
Social contributions (current LCU)
2014,2013,2012,2011,2010,2009,2008,2007
This statistics in other country:
Timeline:
This timeline shows a graph from 2007 to 2014 of Benin. No data until 2006. Number of actual observations by date: 8.
Source name:
World Development Indicators
Source organization:
International Monetary Fund, Government Finance Statistics Yearbook and data files.
Categories, topics:
Public Sector
Last updated:
apr 23, 2017
Indicators value changes by year
Minimum:
12.712 bln
jan 1, 2007
Maximum:
22.8 bln
jan 1, 2014
At the date of observation
Value
Absolute change
Change from previous value
jan 1, 2007
12.712 bln
+12.712 bln
0.0%
jan 1, 2008
12.958 bln
+245.365 mln
1.93%
jan 1, 2009
14.783 bln
+1.826 bln
14.09%
jan 1, 2010
16.214 bln
+1.43 bln
9.67%
jan 1, 2011
16.367 bln
+153.085 mln
0.94%
jan 1, 2012
18.603 bln
+2.236 bln
13.66%
jan 1, 2013
20.718 bln
+2.115 bln
11.37%
jan 1, 2014
22.8 bln
+2.082 bln
10.05%
Ranking of countries by current statistics by years


Comments: