29
/
en
AIzaSyAYiBZKx7MnpbEhh9jyipgxe19OcubqV5w
April 1, 2024
74252
Austria
AUT
true
2
1
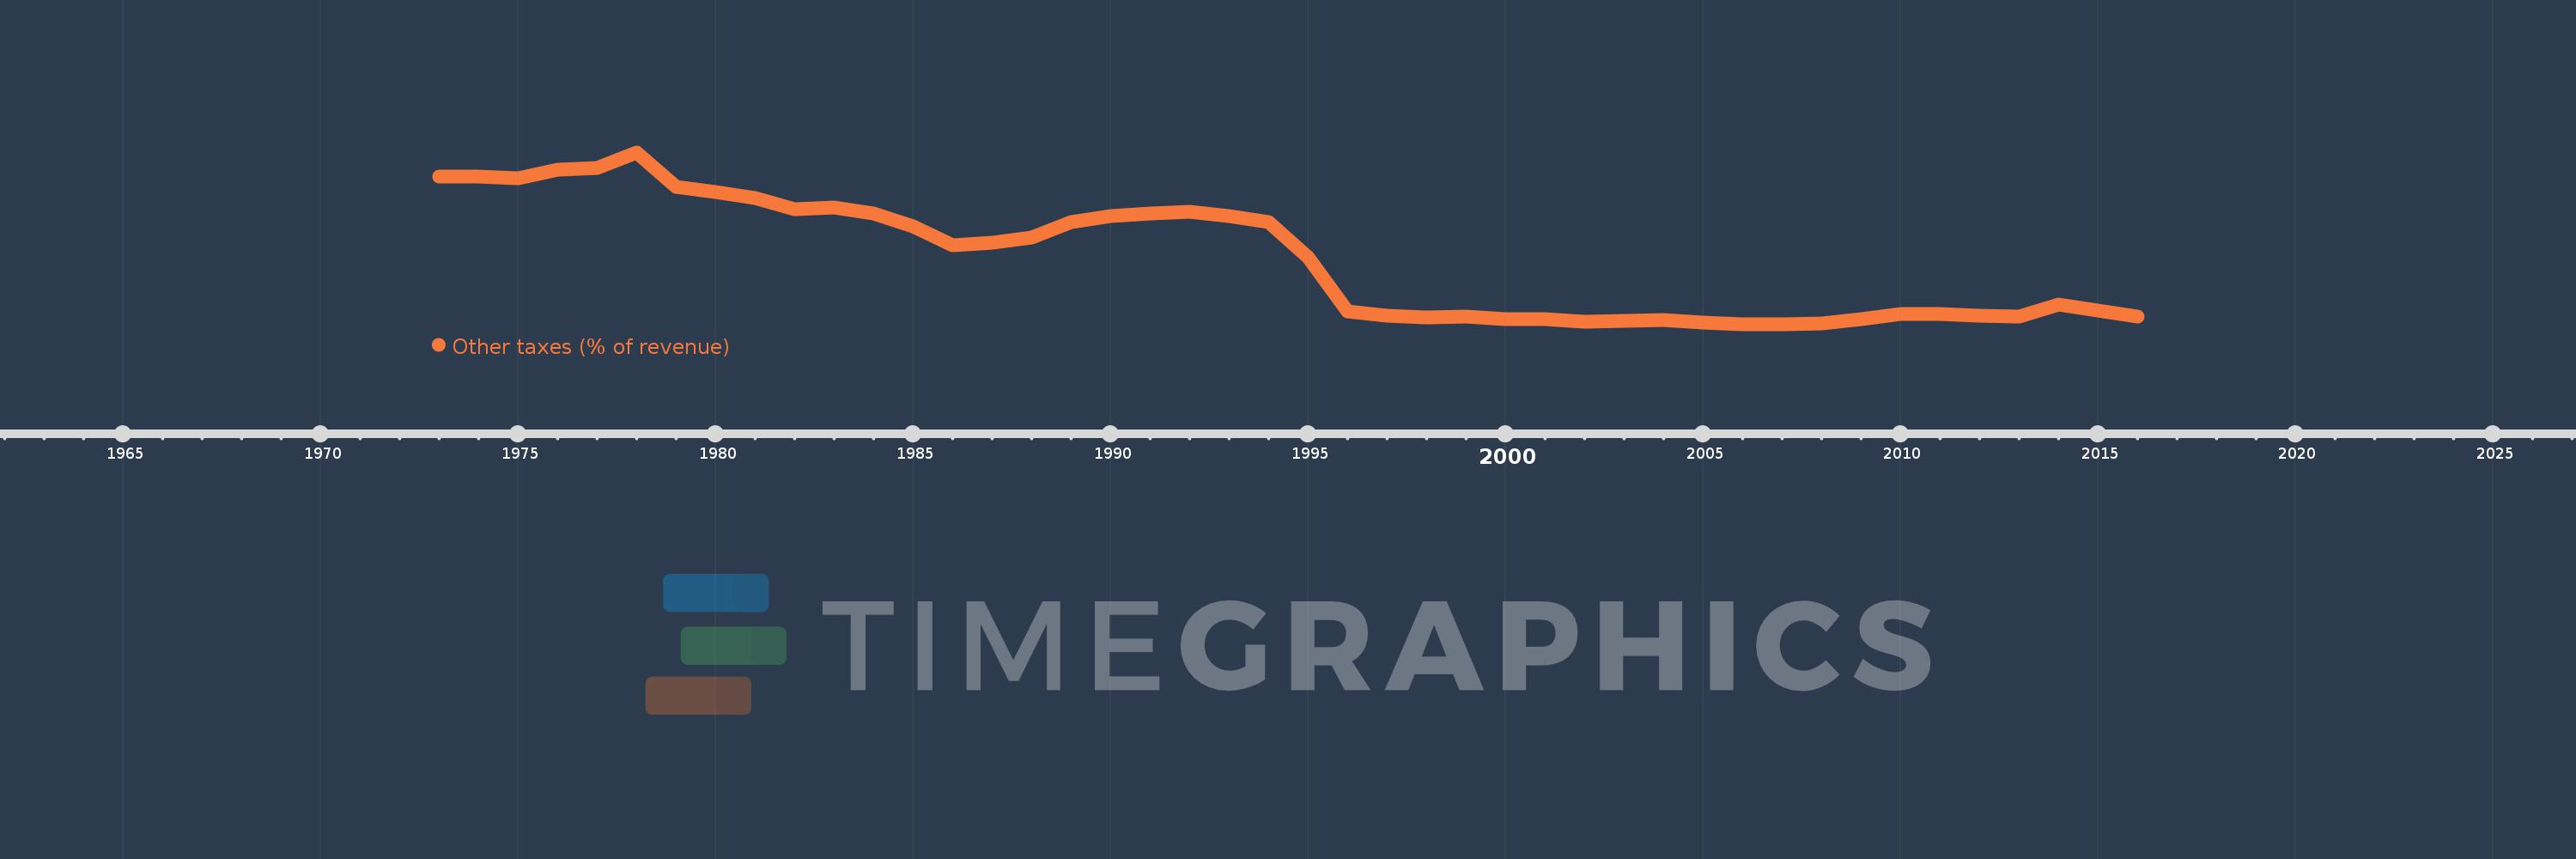
Other taxes (% of revenue)
2016,2015,2014,2013,2012,2011,2010,2009,2008,2007,2006,2005,2004,2003,2002,2001,2000,1999,1998,1997,1996,1995,1994,1993,1992,1991,1990,1989,1988,1987,1986,1985,1984,1983,1982,1981,1980,1979,1978,1977,1976,1975,1974,1973
This statistics in other country:
AfghanistanAlbaniaAlgeriaAngolaAntigua and BarbudaArab WorldArgentinaArmeniaAustraliaAustriaAzerbaijanBahamas, TheBahrainBangladeshBarbadosBelarusBelgiumBelizeBeninBhutanBoliviaBosnia and HerzegovinaBotswanaBrazilBulgariaBurkina FasoBurundiCabo VerdeCambodiaCaribbean small statesCentral African RepublicCentral Europe and the BalticsChileChinaColombiaCongo, Dem. Rep.Congo, Rep.Costa RicaCote d'IvoireCroatiaCyprusCzech RepublicDenmarkDominicaDominican RepublicEarly-demographic dividendEast Asia & PacificEast Asia & Pacific (excluding high income)East Asia & Pacific (IDA & IBRD countries)Egypt, Arab Rep.El SalvadorEquatorial GuineaEstoniaEthiopiaEuro areaEurope & Central AsiaEurope & Central Asia (excluding high income)Europe & Central Asia (IDA & IBRD countries)European UnionFijiFinlandFranceGambia, TheGeorgiaGermanyGreeceGrenadaGuatemalaHeavily indebted poor countries (HIPC)High incomeHondurasHong Kong SAR, ChinaHungaryIBRD onlyIcelandIDA & IBRD totalIDA blendIDA onlyIDA totalIndiaIndonesiaIran, Islamic Rep.IraqIrelandIsraelItalyJamaicaJapanJordanKazakhstanKenyaKiribatiKorea, Rep.KuwaitKyrgyz RepublicLao PDRLate-demographic dividendLatin America & Caribbean Latin America & Caribbean (excluding high income)Latin America & the Caribbean (IDA & IBRD countries)LatviaLeast developed countries: UN classificationLebanonLesothoLiberiaLithuaniaLow & middle incomeLow incomeLower middle incomeLuxembourgMacao SAR, ChinaMacedonia, FYRMadagascarMalawiMalaysiaMaldivesMaliMaltaMauritiusMexicoMicronesia, Fed. Sts.Middle East & North AfricaMiddle East & North Africa (excluding high income)Middle East & North Africa (IDA & IBRD countries)Middle incomeMoldovaMongoliaMoroccoMozambiqueNamibiaNepalNetherlandsNew ZealandNicaraguaNorth AmericaNorwayOECD membersOmanOther small statesPakistanPanamaPapua New GuineaParaguayPeruPhilippinesPolandPortugalPost-demographic dividendPre-demographic dividendRomaniaRussian FederationRwandaSamoaSan MarinoSao Tome and PrincipeSenegalSerbiaSeychellesSierra LeoneSingaporeSlovak RepublicSloveniaSmall statesSolomon IslandsSouth AfricaSouth AsiaSouth Asia (IDA & IBRD)SpainSri LankaSt. Kitts and NevisSt. LuciaSub-Saharan Africa Sub-Saharan Africa (excluding high income)Sub-Saharan Africa (IDA & IBRD countries)SurinameSwazilandSwedenSwitzerlandSyrian Arab RepublicTajikistanTanzaniaThailandTimor-LesteTogoTrinidad and TobagoTunisiaTurkeyUgandaUkraineUnited KingdomUnited StatesUpper middle incomeUruguayVanuatuVenezuela, RBVietnamWest Bank and GazaWorldYemen, Rep.ZambiaZimbabwe Timeline:
This timeline shows a graph from 1973 to 2016 of Austria. No data until 1972. Number of actual observations by date: 44.
Source name:
World Development Indicators
Source organization:
International Monetary Fund, Government Finance Statistics Yearbook and data files.
Categories, topics:
Public Sector
Last updated:
apr 23, 2017
Indicators value changes by year
At the date of observation
Value
Absolute change
Change from previous value
jan 1, 1973
9.865
+9.865
0.0%
jan 1, 1974
9.86
-0.005
-0.05%
jan 1, 1975
9.794
-0.066
-0.67%
jan 1, 1976
10.142
+0.348
3.55%
jan 1, 1977
10.207
+0.066
0.65%
jan 1, 1978
10.86
+0.653
6.4%
jan 1, 1979
9.434
-1.426
-13.13%
jan 1, 1980
9.186
-0.248
-2.63%
jan 1, 1981
8.937
-0.249
-2.71%
jan 1, 1982
8.482
-0.455
-5.09%
jan 1, 1983
8.547
+0.065
0.77%
jan 1, 1984
8.304
-0.243
-2.84%
jan 1, 1985
7.773
-0.531
-6.39%
jan 1, 1986
6.986
-0.787
-10.13%
jan 1, 1987
7.088
+0.103
1.47%
jan 1, 1988
7.282
+0.194
2.73%
jan 1, 1989
7.956
+0.674
9.26%
jan 1, 1990
8.205
+0.249
3.13%
jan 1, 1991
8.32
+0.115
1.4%
jan 1, 1992
8.371
+0.051
0.61%
jan 1, 1993
8.205
-0.166
-1.98%
jan 1, 1994
7.931
-0.274
-3.34%
jan 1, 1995
6.461
-1.47
-18.54%
jan 1, 1996
4.192
-2.269
-35.11%
jan 1, 1997
4.008
-0.185
-4.4%
jan 1, 1998
3.937
-0.071
-1.76%
jan 1, 1999
3.977
+0.04
1.01%
jan 1, 2000
3.892
-0.085
-2.15%
jan 1, 2001
3.876
-0.015
-0.39%
jan 1, 2002
3.787
-0.089
-2.3%
jan 1, 2003
3.802
+0.015
0.39%
jan 1, 2004
3.835
+0.033
0.87%
jan 1, 2005
3.749
-0.086
-2.24%
jan 1, 2006
3.668
-0.081
-2.17%
jan 1, 2007
3.679
+0.011
0.31%
jan 1, 2008
3.689
+0.01
0.26%
jan 1, 2009
3.889
+0.2
5.42%
jan 1, 2010
4.108
+0.22
5.65%
jan 1, 2011
4.102
-0.006
-0.16%
jan 1, 2012
4.021
-0.081
-1.96%
jan 1, 2013
3.998
-0.023
-0.58%
jan 1, 2014
4.496
+0.498
12.45%
jan 1, 2015
4.222
-0.274
-6.09%
jan 1, 2016
3.989
-0.233
-5.51%
Ranking of countries by current statistics by years


Comments: