29
/
en
AIzaSyAYiBZKx7MnpbEhh9jyipgxe19OcubqV5w
April 1, 2024
133488
Finland
FIN
true
2
1
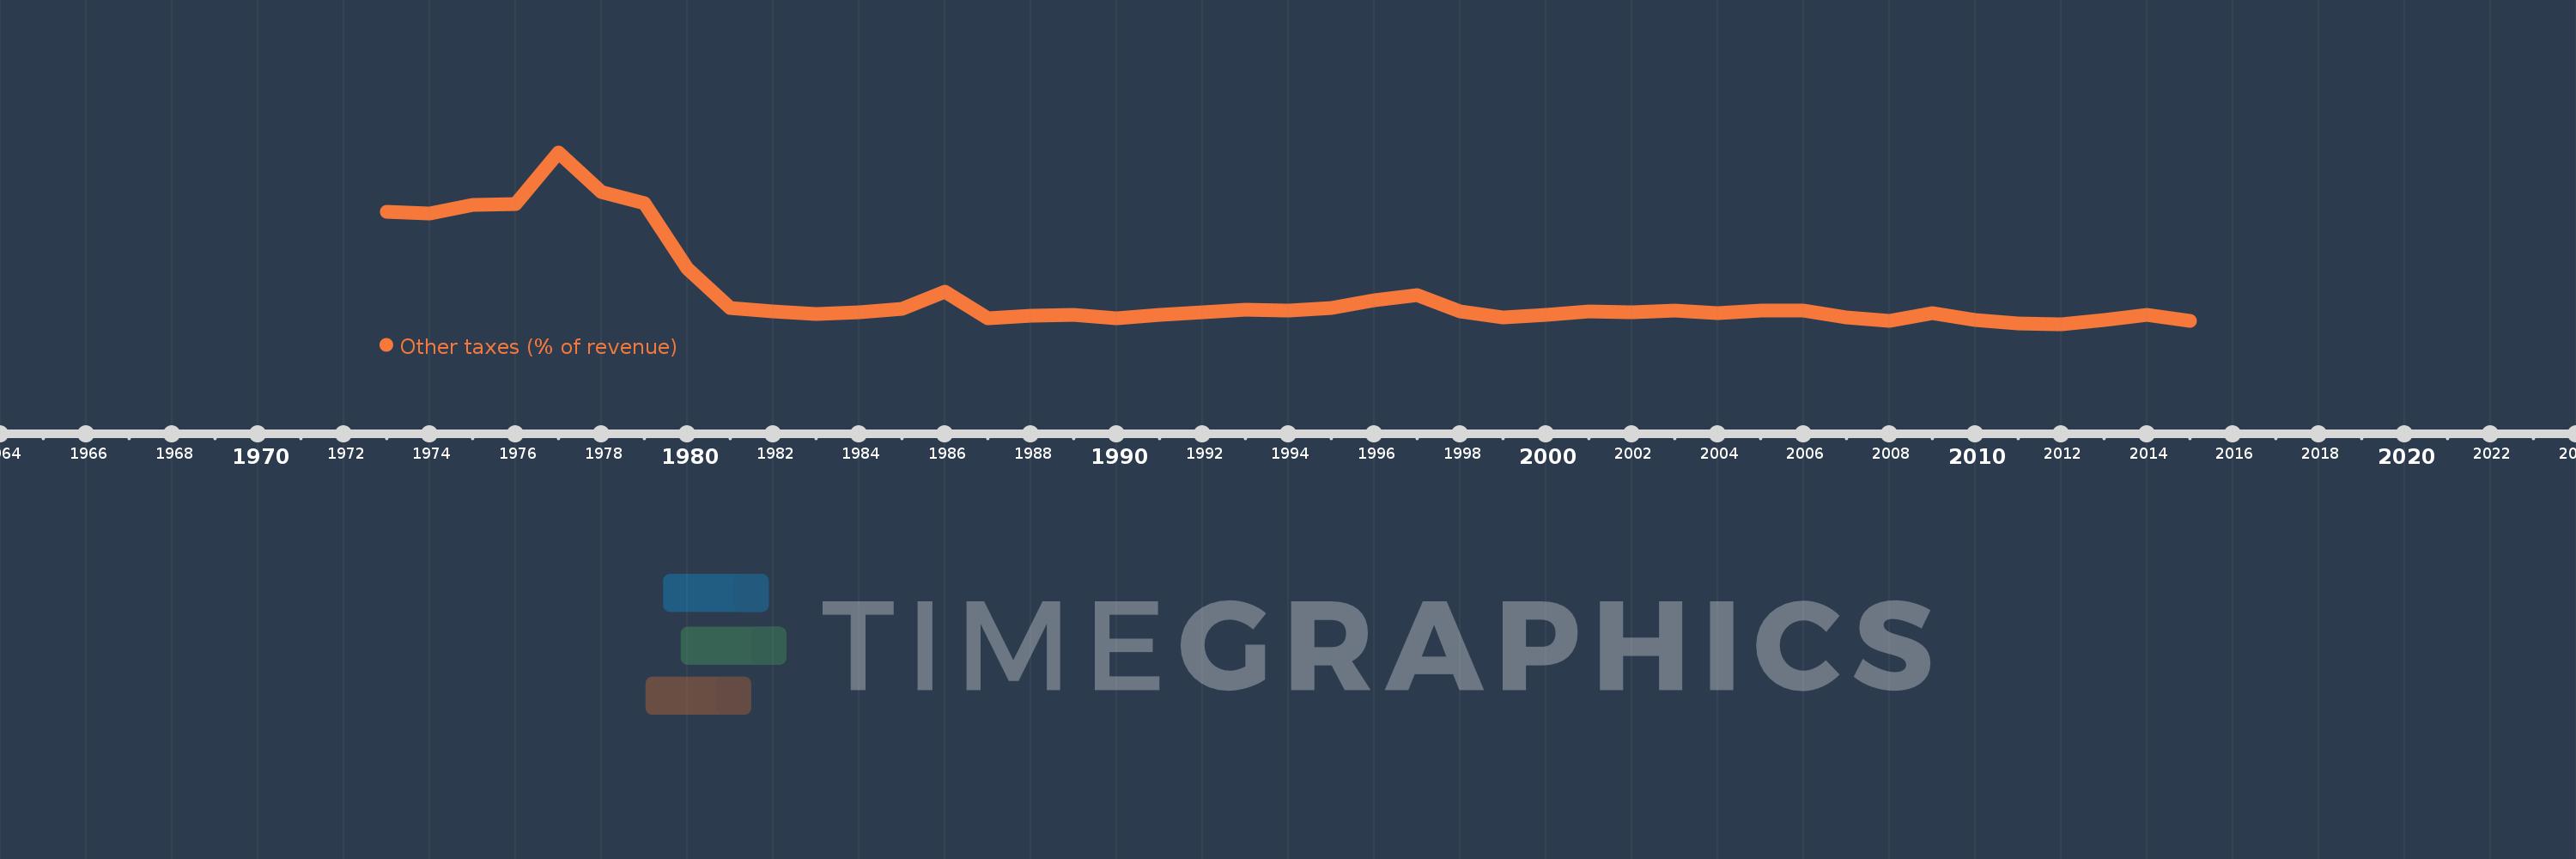
Other taxes (% of revenue)
2015,2014,2013,2012,2011,2010,2009,2008,2007,2006,2005,2004,2003,2002,2001,2000,1999,1998,1997,1996,1995,1994,1993,1992,1991,1990,1989,1988,1987,1986,1985,1984,1983,1982,1981,1980,1979,1978,1977,1976,1975,1974,1973
This statistics in other country:
AfghanistanAlbaniaAlgeriaAngolaAntigua and BarbudaArab WorldArgentinaArmeniaAustraliaAustriaAzerbaijanBahamas, TheBahrainBangladeshBarbadosBelarusBelgiumBelizeBeninBhutanBoliviaBosnia and HerzegovinaBotswanaBrazilBulgariaBurkina FasoBurundiCabo VerdeCambodiaCaribbean small statesCentral African RepublicCentral Europe and the BalticsChileChinaColombiaCongo, Dem. Rep.Congo, Rep.Costa RicaCote d'IvoireCroatiaCyprusCzech RepublicDenmarkDominicaDominican RepublicEarly-demographic dividendEast Asia & PacificEast Asia & Pacific (excluding high income)East Asia & Pacific (IDA & IBRD countries)Egypt, Arab Rep.El SalvadorEquatorial GuineaEstoniaEthiopiaEuro areaEurope & Central AsiaEurope & Central Asia (excluding high income)Europe & Central Asia (IDA & IBRD countries)European UnionFijiFinlandFranceGambia, TheGeorgiaGermanyGreeceGrenadaGuatemalaHeavily indebted poor countries (HIPC)High incomeHondurasHong Kong SAR, ChinaHungaryIBRD onlyIcelandIDA & IBRD totalIDA blendIDA onlyIDA totalIndiaIndonesiaIran, Islamic Rep.IraqIrelandIsraelItalyJamaicaJapanJordanKazakhstanKenyaKiribatiKorea, Rep.KuwaitKyrgyz RepublicLao PDRLate-demographic dividendLatin America & Caribbean Latin America & Caribbean (excluding high income)Latin America & the Caribbean (IDA & IBRD countries)LatviaLeast developed countries: UN classificationLebanonLesothoLiberiaLithuaniaLow & middle incomeLow incomeLower middle incomeLuxembourgMacao SAR, ChinaMacedonia, FYRMadagascarMalawiMalaysiaMaldivesMaliMaltaMauritiusMexicoMicronesia, Fed. Sts.Middle East & North AfricaMiddle East & North Africa (excluding high income)Middle East & North Africa (IDA & IBRD countries)Middle incomeMoldovaMongoliaMoroccoMozambiqueNamibiaNepalNetherlandsNew ZealandNicaraguaNorth AmericaNorwayOECD membersOmanOther small statesPakistanPanamaPapua New GuineaParaguayPeruPhilippinesPolandPortugalPost-demographic dividendPre-demographic dividendRomaniaRussian FederationRwandaSamoaSan MarinoSao Tome and PrincipeSenegalSerbiaSeychellesSierra LeoneSingaporeSlovak RepublicSloveniaSmall statesSolomon IslandsSouth AfricaSouth AsiaSouth Asia (IDA & IBRD)SpainSri LankaSt. Kitts and NevisSt. LuciaSub-Saharan Africa Sub-Saharan Africa (excluding high income)Sub-Saharan Africa (IDA & IBRD countries)SurinameSwazilandSwedenSwitzerlandSyrian Arab RepublicTajikistanTanzaniaThailandTimor-LesteTogoTrinidad and TobagoTunisiaTurkeyUgandaUkraineUnited KingdomUnited StatesUpper middle incomeUruguayVanuatuVenezuela, RBVietnamWest Bank and GazaWorldYemen, Rep.ZambiaZimbabwe Timeline:
This timeline shows a graph from 1973 to 2015 of Finland. No data until 1972. Number of actual observations by date: 43.
Source name:
World Development Indicators
Source organization:
International Monetary Fund, Government Finance Statistics Yearbook and data files.
Categories, topics:
Public Sector
Last updated:
apr 23, 2017
Indicators value changes by year
At the date of observation
Value
Absolute change
Change from previous value
jan 1, 1973
4.054
+4.054
0.0%
jan 1, 1974
4.003
-0.051
-1.25%
jan 1, 1975
4.268
+0.265
6.62%
jan 1, 1976
4.295
+0.027
0.63%
jan 1, 1977
5.932
+1.637
38.11%
jan 1, 1978
4.692
-1.24
-20.9%
jan 1, 1979
4.335
-0.357
-7.61%
jan 1, 1980
2.28
-2.055
-47.4%
jan 1, 1981
1.034
-1.246
-54.64%
jan 1, 1982
0.928
-0.106
-10.26%
jan 1, 1983
0.856
-0.072
-7.8%
jan 1, 1984
0.906
+0.051
5.92%
jan 1, 1985
1.018
+0.112
12.34%
jan 1, 1986
1.558
+0.54
52.99%
jan 1, 1987
0.716
-0.842
-54.04%
jan 1, 1988
0.788
+0.072
10.03%
jan 1, 1989
0.83
+0.042
5.32%
jan 1, 1990
0.722
-0.108
-13.01%
jan 1, 1991
0.81
+0.088
12.25%
jan 1, 1992
0.911
+0.1
12.41%
jan 1, 1993
0.987
+0.076
8.37%
jan 1, 1994
0.95
-0.037
-3.77%
jan 1, 1995
1.042
+0.093
9.78%
jan 1, 1996
1.273
+0.231
22.13%
jan 1, 1997
1.44
+0.167
13.13%
jan 1, 1998
0.929
-0.511
-35.51%
jan 1, 1999
0.751
-0.178
-19.14%
jan 1, 2000
0.806
+0.055
7.33%
jan 1, 2001
0.932
+0.126
15.6%
jan 1, 2002
0.904
-0.028
-2.95%
jan 1, 2003
0.962
+0.057
6.33%
jan 1, 2004
0.862
-0.099
-10.31%
jan 1, 2005
0.957
+0.095
11.01%
jan 1, 2006
0.958
+0.001
0.08%
jan 1, 2007
0.744
-0.214
-22.31%
jan 1, 2008
0.632
-0.112
-15.06%
jan 1, 2009
0.864
+0.232
36.7%
jan 1, 2010
0.649
-0.215
-24.86%
jan 1, 2011
0.56
-0.09
-13.81%
jan 1, 2012
0.524
-0.036
-6.41%
jan 1, 2013
0.655
+0.131
25.07%
jan 1, 2014
0.811
+0.156
23.83%
jan 1, 2015
0.623
-0.188
-23.22%
Ranking of countries by current statistics by years


Comments: