29
/
en
AIzaSyAYiBZKx7MnpbEhh9jyipgxe19OcubqV5w
April 1, 2024
246050
South Africa
ZAF
true
2
1
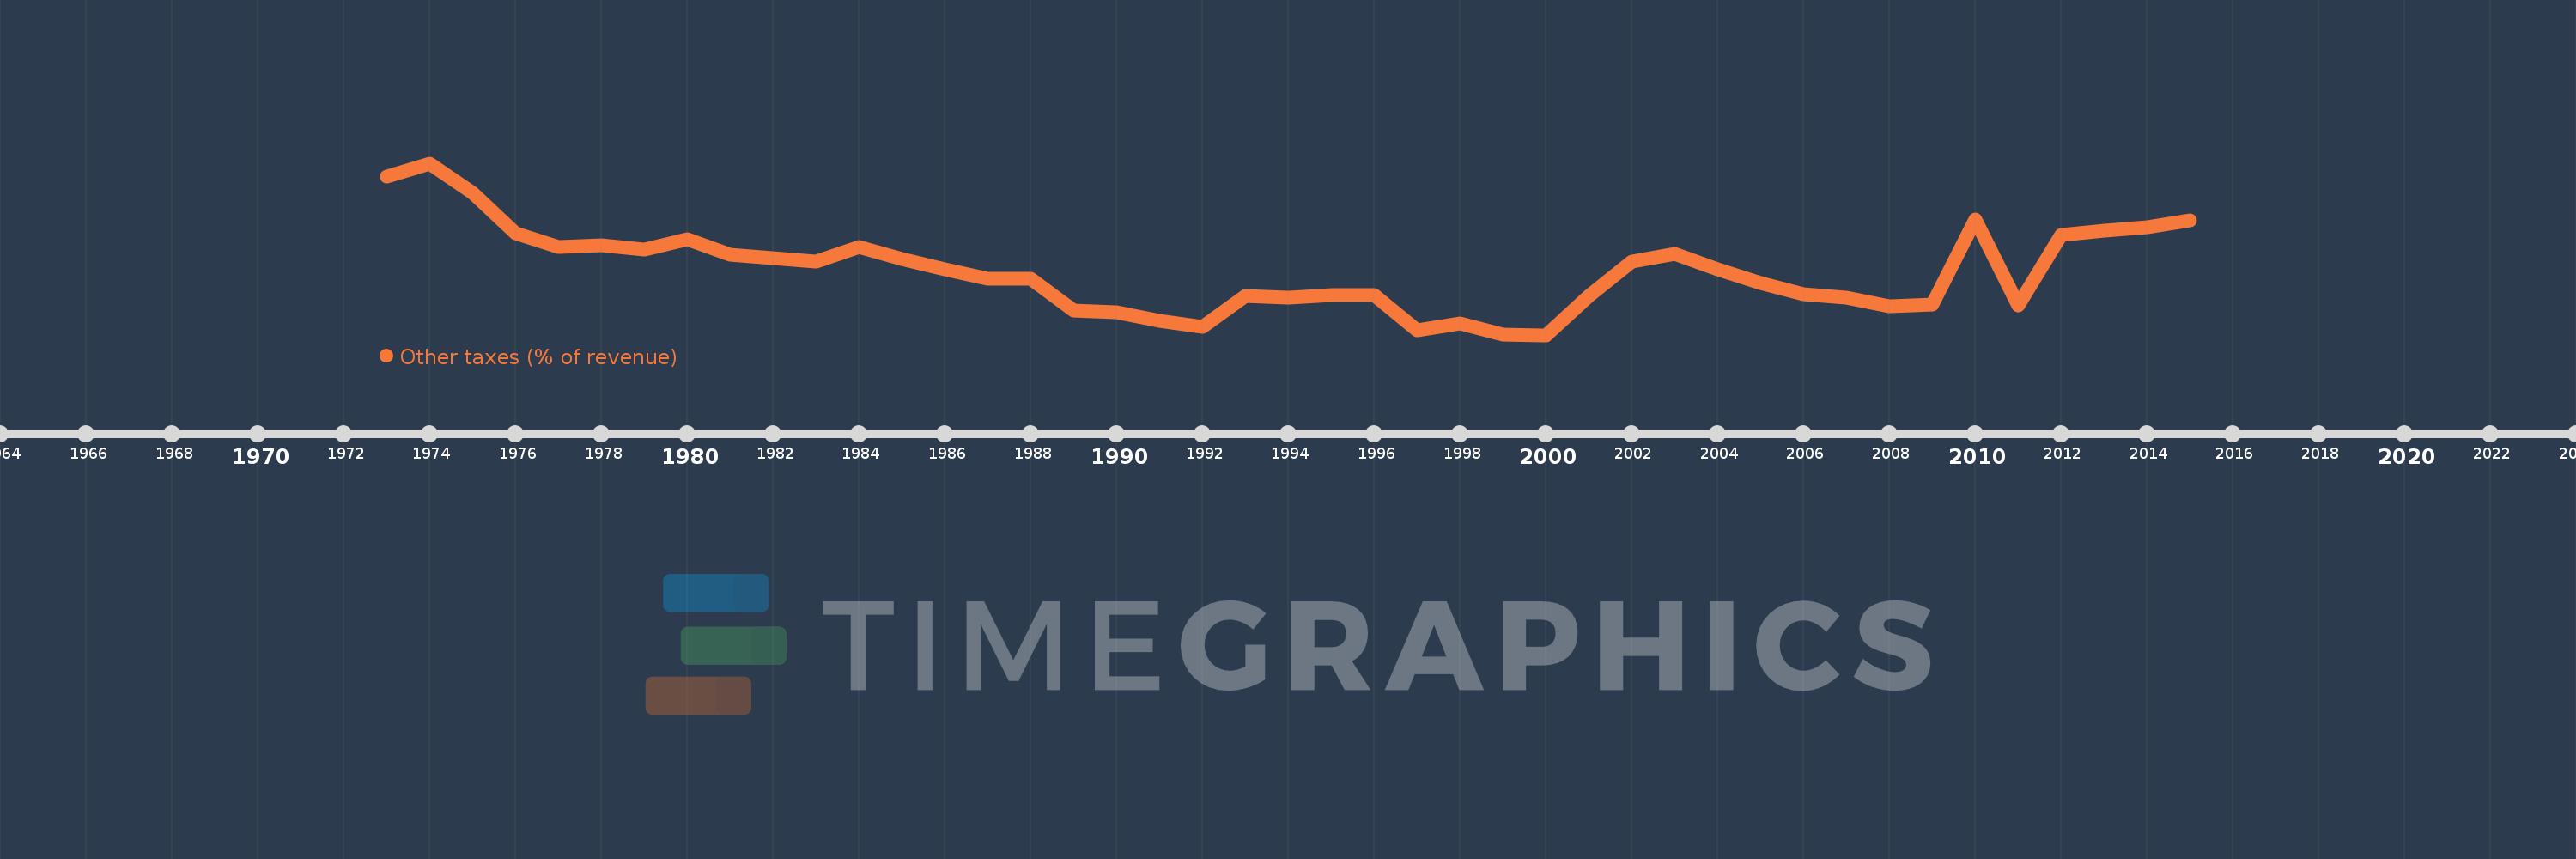
Other taxes (% of revenue)
2015,2014,2013,2012,2011,2010,2009,2008,2007,2006,2005,2004,2003,2002,2001,2000,1999,1998,1997,1996,1995,1994,1993,1992,1991,1990,1989,1988,1987,1986,1985,1984,1983,1982,1981,1980,1979,1978,1977,1976,1975,1974,1973
This statistics in other country:
AfghanistanAlbaniaAlgeriaAngolaAntigua and BarbudaArab WorldArgentinaArmeniaAustraliaAustriaAzerbaijanBahamas, TheBahrainBangladeshBarbadosBelarusBelgiumBelizeBeninBhutanBoliviaBosnia and HerzegovinaBotswanaBrazilBulgariaBurkina FasoBurundiCabo VerdeCambodiaCaribbean small statesCentral African RepublicCentral Europe and the BalticsChileChinaColombiaCongo, Dem. Rep.Congo, Rep.Costa RicaCote d'IvoireCroatiaCyprusCzech RepublicDenmarkDominicaDominican RepublicEarly-demographic dividendEast Asia & PacificEast Asia & Pacific (excluding high income)East Asia & Pacific (IDA & IBRD countries)Egypt, Arab Rep.El SalvadorEquatorial GuineaEstoniaEthiopiaEuro areaEurope & Central AsiaEurope & Central Asia (excluding high income)Europe & Central Asia (IDA & IBRD countries)European UnionFijiFinlandFranceGambia, TheGeorgiaGermanyGreeceGrenadaGuatemalaHeavily indebted poor countries (HIPC)High incomeHondurasHong Kong SAR, ChinaHungaryIBRD onlyIcelandIDA & IBRD totalIDA blendIDA onlyIDA totalIndiaIndonesiaIran, Islamic Rep.IraqIrelandIsraelItalyJamaicaJapanJordanKazakhstanKenyaKiribatiKorea, Rep.KuwaitKyrgyz RepublicLao PDRLate-demographic dividendLatin America & Caribbean Latin America & Caribbean (excluding high income)Latin America & the Caribbean (IDA & IBRD countries)LatviaLeast developed countries: UN classificationLebanonLesothoLiberiaLithuaniaLow & middle incomeLow incomeLower middle incomeLuxembourgMacao SAR, ChinaMacedonia, FYRMadagascarMalawiMalaysiaMaldivesMaliMaltaMauritiusMexicoMicronesia, Fed. Sts.Middle East & North AfricaMiddle East & North Africa (excluding high income)Middle East & North Africa (IDA & IBRD countries)Middle incomeMoldovaMongoliaMoroccoMozambiqueNamibiaNepalNetherlandsNew ZealandNicaraguaNorth AmericaNorwayOECD membersOmanOther small statesPakistanPanamaPapua New GuineaParaguayPeruPhilippinesPolandPortugalPost-demographic dividendPre-demographic dividendRomaniaRussian FederationRwandaSamoaSan MarinoSao Tome and PrincipeSenegalSerbiaSeychellesSierra LeoneSingaporeSlovak RepublicSloveniaSmall statesSolomon IslandsSouth AfricaSouth AsiaSouth Asia (IDA & IBRD)SpainSri LankaSt. Kitts and NevisSt. LuciaSub-Saharan Africa Sub-Saharan Africa (excluding high income)Sub-Saharan Africa (IDA & IBRD countries)SurinameSwazilandSwedenSwitzerlandSyrian Arab RepublicTajikistanTanzaniaThailandTimor-LesteTogoTrinidad and TobagoTunisiaTurkeyUgandaUkraineUnited KingdomUnited StatesUpper middle incomeUruguayVanuatuVenezuela, RBVietnamWest Bank and GazaWorldYemen, Rep.ZambiaZimbabwe Timeline:
This timeline shows a graph from 1973 to 2015 of South Africa. No data until 1972. Number of actual observations by date: 43.
Source name:
World Development Indicators
Source organization:
International Monetary Fund, Government Finance Statistics Yearbook and data files.
Categories, topics:
Public Sector
Last updated:
apr 23, 2017
Indicators value changes by year
At the date of observation
Value
Absolute change
Change from previous value
jan 1, 1973
2.822
+2.822
0.0%
jan 1, 1974
2.987
+0.164
5.82%
jan 1, 1975
2.62
-0.367
-12.27%
jan 1, 1976
2.121
-0.499
-19.06%
jan 1, 1977
1.949
-0.172
-8.09%
jan 1, 1978
1.974
+0.025
1.26%
jan 1, 1979
1.921
-0.053
-2.71%
jan 1, 1980
2.044
+0.123
6.42%
jan 1, 1981
1.861
-0.182
-8.93%
jan 1, 1982
1.815
-0.046
-2.5%
jan 1, 1983
1.776
-0.039
-2.14%
jan 1, 1984
1.949
+0.173
9.74%
jan 1, 1985
1.809
-0.14
-7.17%
jan 1, 1986
1.678
-0.131
-7.25%
jan 1, 1987
1.562
-0.116
-6.91%
jan 1, 1988
1.562
0.0
-0.01%
jan 1, 1989
1.17
-0.392
-25.11%
jan 1, 1990
1.149
-0.021
-1.76%
jan 1, 1991
1.044
-0.105
-9.16%
jan 1, 1992
0.97
-0.074
-7.07%
jan 1, 1993
1.351
+0.381
39.26%
jan 1, 1994
1.325
-0.026
-1.93%
jan 1, 1995
1.356
+0.031
2.31%
jan 1, 1996
1.362
+0.006
0.46%
jan 1, 1997
0.927
-0.435
-31.94%
jan 1, 1998
1.008
+0.081
8.75%
jan 1, 1999
0.876
-0.132
-13.14%
jan 1, 2000
0.866
-0.01
-1.13%
jan 1, 2001
1.35
+0.484
55.96%
jan 1, 2002
1.774
+0.424
31.42%
jan 1, 2003
1.873
+0.099
5.59%
jan 1, 2004
1.675
-0.199
-10.62%
jan 1, 2005
1.507
-0.167
-9.98%
jan 1, 2006
1.37
-0.138
-9.14%
jan 1, 2007
1.325
-0.044
-3.24%
jan 1, 2008
1.22
-0.105
-7.92%
jan 1, 2009
1.243
+0.023
1.87%
jan 1, 2010
2.29
+1.047
84.22%
jan 1, 2011
1.23
-1.06
-46.3%
jan 1, 2012
2.104
+0.874
71.09%
jan 1, 2013
2.158
+0.054
2.55%
jan 1, 2014
2.193
+0.035
1.61%
jan 1, 2015
2.281
+0.089
4.04%
Ranking of countries by current statistics by years


Comments: