29
/
en
AIzaSyAYiBZKx7MnpbEhh9jyipgxe19OcubqV5w
April 1, 2024
125255
Egypt, Arab Rep.
EGY
true
2
1
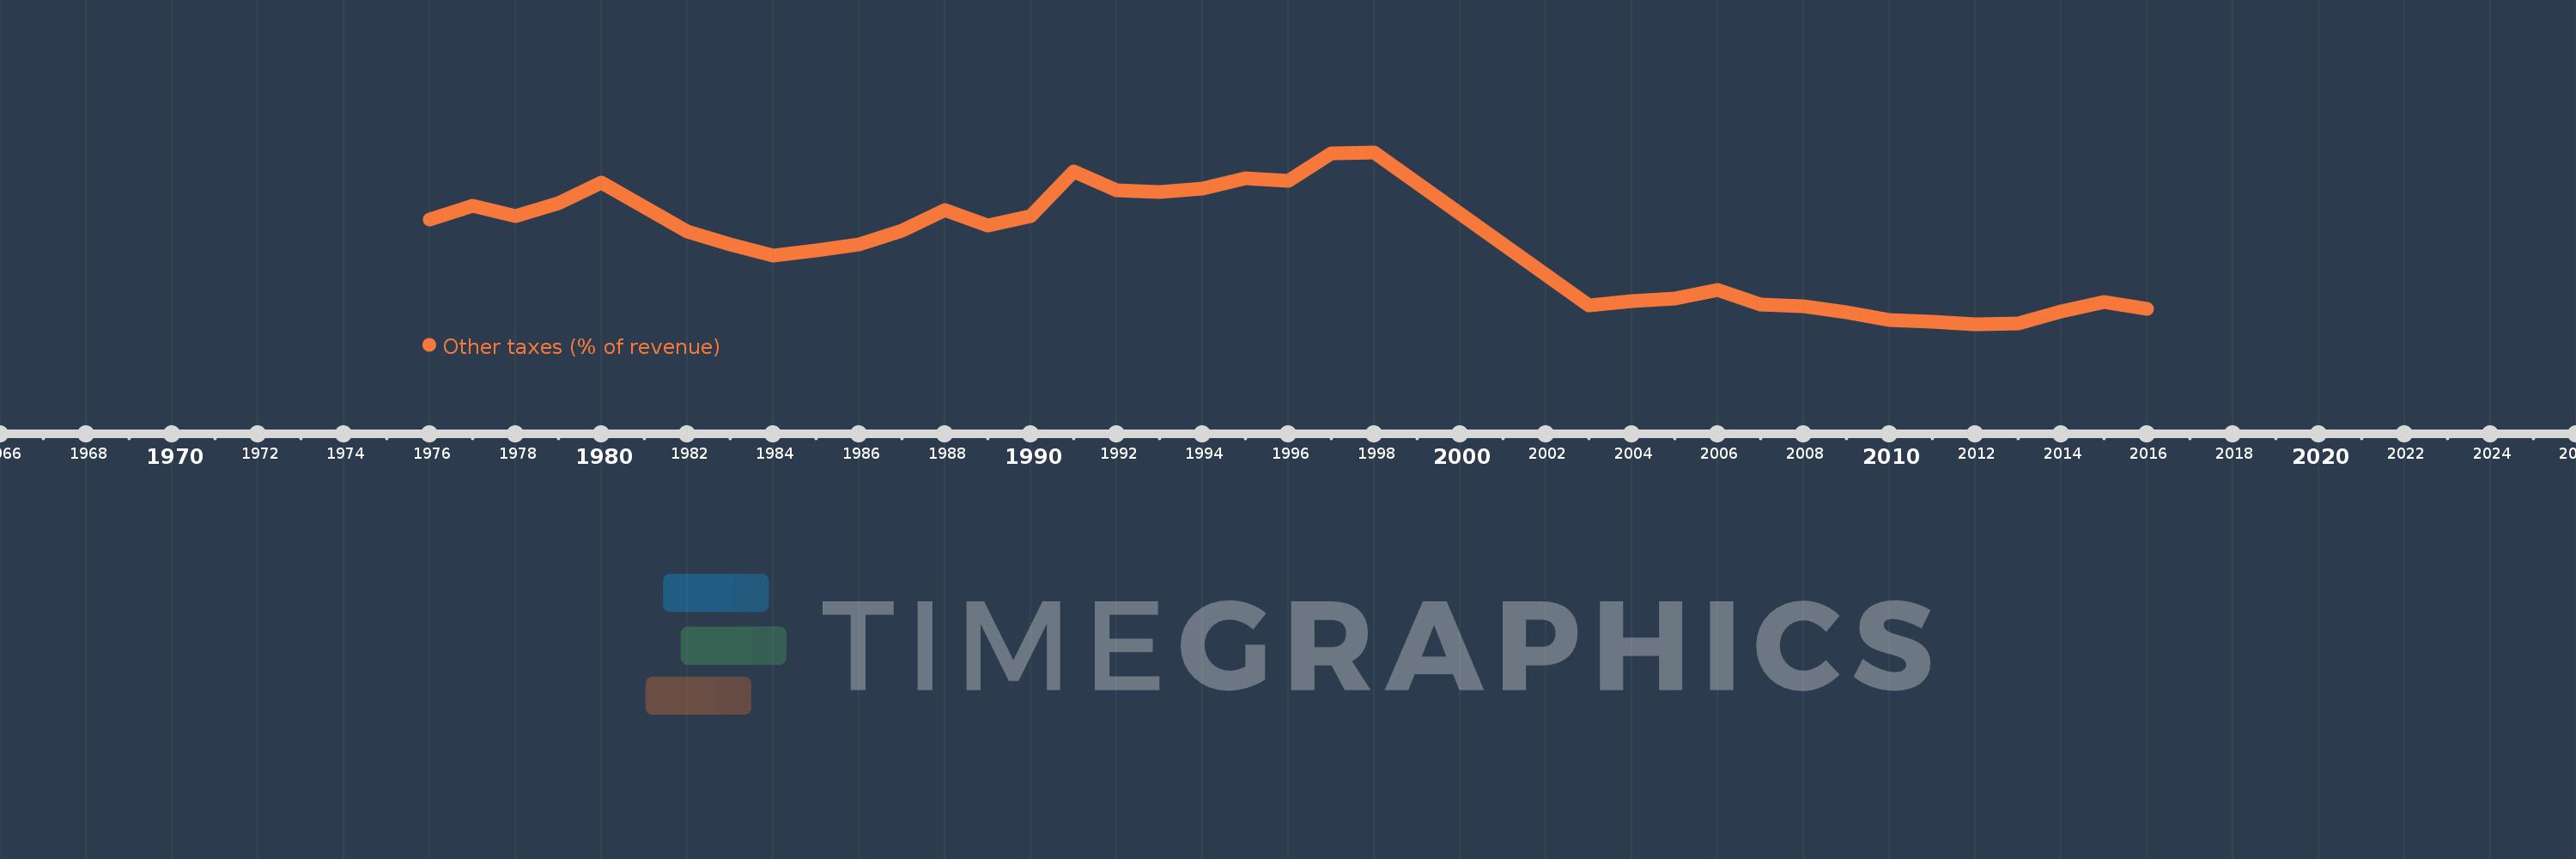
Other taxes (% of revenue)
2016,2015,2014,2013,2012,2011,2010,2009,2008,2007,2006,2005,2004,2003,1998,1997,1996,1995,1994,1993,1992,1991,1990,1989,1988,1987,1986,1985,1984,1983,1982,1980,1979,1978,1977,1976
This statistics in other country:
AfghanistanAlbaniaAlgeriaAngolaAntigua and BarbudaArab WorldArgentinaArmeniaAustraliaAustriaAzerbaijanBahamas, TheBahrainBangladeshBarbadosBelarusBelgiumBelizeBeninBhutanBoliviaBosnia and HerzegovinaBotswanaBrazilBulgariaBurkina FasoBurundiCabo VerdeCambodiaCaribbean small statesCentral African RepublicCentral Europe and the BalticsChileChinaColombiaCongo, Dem. Rep.Congo, Rep.Costa RicaCote d'IvoireCroatiaCyprusCzech RepublicDenmarkDominicaDominican RepublicEarly-demographic dividendEast Asia & PacificEast Asia & Pacific (excluding high income)East Asia & Pacific (IDA & IBRD countries)Egypt, Arab Rep.El SalvadorEquatorial GuineaEstoniaEthiopiaEuro areaEurope & Central AsiaEurope & Central Asia (excluding high income)Europe & Central Asia (IDA & IBRD countries)European UnionFijiFinlandFranceGambia, TheGeorgiaGermanyGreeceGrenadaGuatemalaHeavily indebted poor countries (HIPC)High incomeHondurasHong Kong SAR, ChinaHungaryIBRD onlyIcelandIDA & IBRD totalIDA blendIDA onlyIDA totalIndiaIndonesiaIran, Islamic Rep.IraqIrelandIsraelItalyJamaicaJapanJordanKazakhstanKenyaKiribatiKorea, Rep.KuwaitKyrgyz RepublicLao PDRLate-demographic dividendLatin America & Caribbean Latin America & Caribbean (excluding high income)Latin America & the Caribbean (IDA & IBRD countries)LatviaLeast developed countries: UN classificationLebanonLesothoLiberiaLithuaniaLow & middle incomeLow incomeLower middle incomeLuxembourgMacao SAR, ChinaMacedonia, FYRMadagascarMalawiMalaysiaMaldivesMaliMaltaMauritiusMexicoMicronesia, Fed. Sts.Middle East & North AfricaMiddle East & North Africa (excluding high income)Middle East & North Africa (IDA & IBRD countries)Middle incomeMoldovaMongoliaMoroccoMozambiqueNamibiaNepalNetherlandsNew ZealandNicaraguaNorth AmericaNorwayOECD membersOmanOther small statesPakistanPanamaPapua New GuineaParaguayPeruPhilippinesPolandPortugalPost-demographic dividendPre-demographic dividendRomaniaRussian FederationRwandaSamoaSan MarinoSao Tome and PrincipeSenegalSerbiaSeychellesSierra LeoneSingaporeSlovak RepublicSloveniaSmall statesSolomon IslandsSouth AfricaSouth AsiaSouth Asia (IDA & IBRD)SpainSri LankaSt. Kitts and NevisSt. LuciaSub-Saharan Africa Sub-Saharan Africa (excluding high income)Sub-Saharan Africa (IDA & IBRD countries)SurinameSwazilandSwedenSwitzerlandSyrian Arab RepublicTajikistanTanzaniaThailandTimor-LesteTogoTrinidad and TobagoTunisiaTurkeyUgandaUkraineUnited KingdomUnited StatesUpper middle incomeUruguayVanuatuVenezuela, RBVietnamWest Bank and GazaWorldYemen, Rep.ZambiaZimbabwe Timeline:
This timeline shows a graph from 1976 to 2016 of Egypt, Arab Rep.. No data until 1975. Number of actual observations by date: 36.
Source name:
World Development Indicators
Source organization:
International Monetary Fund, Government Finance Statistics Yearbook and data files.
Categories, topics:
Public Sector
Last updated:
apr 23, 2017
Indicators value changes by year
Maximum:
10.687
jan 1, 1998
At the date of observation
Value
Absolute change
Change from previous value
jan 1, 1976
7.204
+7.204
0.0%
jan 1, 1977
7.921
+0.717
9.96%
jan 1, 1978
7.361
-0.559
-7.06%
jan 1, 1979
8.02
+0.659
8.95%
jan 1, 1980
9.122
+1.102
13.74%
jan 1, 1982
6.575
-2.547
-27.92%
jan 1, 1983
5.88
-0.696
-10.58%
jan 1, 1984
5.292
-0.588
-9.99%
jan 1, 1985
5.598
+0.306
5.78%
jan 1, 1986
5.912
+0.314
5.61%
jan 1, 1987
6.593
+0.681
11.52%
jan 1, 1988
7.685
+1.093
16.58%
jan 1, 1989
6.881
-0.804
-10.46%
jan 1, 1990
7.379
+0.498
7.23%
jan 1, 1991
9.712
+2.333
31.62%
jan 1, 1992
8.702
-1.01
-10.4%
jan 1, 1993
8.61
-0.092
-1.06%
jan 1, 1994
8.806
+0.195
2.27%
jan 1, 1995
9.341
+0.535
6.08%
jan 1, 1996
9.217
-0.124
-1.32%
jan 1, 1997
10.63
+1.412
15.32%
jan 1, 1998
10.687
+0.057
0.54%
jan 1, 2003
2.716
-7.971
-74.58%
jan 1, 2004
2.952
+0.236
8.69%
jan 1, 2005
3.064
+0.112
3.78%
jan 1, 2006
3.536
+0.472
15.41%
jan 1, 2007
2.746
-0.79
-22.36%
jan 1, 2008
2.686
-0.059
-2.16%
jan 1, 2009
2.345
-0.341
-12.71%
jan 1, 2010
1.969
-0.376
-16.04%
jan 1, 2011
1.867
-0.102
-5.17%
jan 1, 2012
1.732
-0.135
-7.22%
jan 1, 2013
1.779
+0.047
2.73%
jan 1, 2014
2.417
+0.638
35.83%
jan 1, 2015
2.883
+0.466
19.29%
jan 1, 2016
2.547
-0.336
-11.66%
Ranking of countries by current statistics by years


Comments: