29
/
en
AIzaSyAYiBZKx7MnpbEhh9jyipgxe19OcubqV5w
April 1, 2024
122586
Dominican Republic
DOM
true
2
1
Other taxes (% of revenue)
2015,2014,2013,2012,2011,2010,2009,2008,2007,2006,2005,2004,2003,2002,2001,2000,1999,1998,1997,1996,1995,1994,1993,1992,1991,1990,1989,1988,1987,1986,1985,1984,1983,1982,1981,1980,1979,1978,1977,1976,1975,1974,1973
This statistics in other country:
AfghanistanAlbaniaAlgeriaAngolaAntigua and BarbudaArab WorldArgentinaArmeniaAustraliaAustriaAzerbaijanBahamas, TheBahrainBangladeshBarbadosBelarusBelgiumBelizeBeninBhutanBoliviaBosnia and HerzegovinaBotswanaBrazilBulgariaBurkina FasoBurundiCabo VerdeCambodiaCaribbean small statesCentral African RepublicCentral Europe and the BalticsChileChinaColombiaCongo, Dem. Rep.Congo, Rep.Costa RicaCote d'IvoireCroatiaCyprusCzech RepublicDenmarkDominicaDominican RepublicEarly-demographic dividendEast Asia & PacificEast Asia & Pacific (excluding high income)East Asia & Pacific (IDA & IBRD countries)Egypt, Arab Rep.El SalvadorEquatorial GuineaEstoniaEthiopiaEuro areaEurope & Central AsiaEurope & Central Asia (excluding high income)Europe & Central Asia (IDA & IBRD countries)European UnionFijiFinlandFranceGambia, TheGeorgiaGermanyGreeceGrenadaGuatemalaHeavily indebted poor countries (HIPC)High incomeHondurasHong Kong SAR, ChinaHungaryIBRD onlyIcelandIDA & IBRD totalIDA blendIDA onlyIDA totalIndiaIndonesiaIran, Islamic Rep.IraqIrelandIsraelItalyJamaicaJapanJordanKazakhstanKenyaKiribatiKorea, Rep.KuwaitKyrgyz RepublicLao PDRLate-demographic dividendLatin America & Caribbean Latin America & Caribbean (excluding high income)Latin America & the Caribbean (IDA & IBRD countries)LatviaLeast developed countries: UN classificationLebanonLesothoLiberiaLithuaniaLow & middle incomeLow incomeLower middle incomeLuxembourgMacao SAR, ChinaMacedonia, FYRMadagascarMalawiMalaysiaMaldivesMaliMaltaMauritiusMexicoMicronesia, Fed. Sts.Middle East & North AfricaMiddle East & North Africa (excluding high income)Middle East & North Africa (IDA & IBRD countries)Middle incomeMoldovaMongoliaMoroccoMozambiqueNamibiaNepalNetherlandsNew ZealandNicaraguaNorth AmericaNorwayOECD membersOmanOther small statesPakistanPanamaPapua New GuineaParaguayPeruPhilippinesPolandPortugalPost-demographic dividendPre-demographic dividendRomaniaRussian FederationRwandaSamoaSan MarinoSao Tome and PrincipeSenegalSerbiaSeychellesSierra LeoneSingaporeSlovak RepublicSloveniaSmall statesSolomon IslandsSouth AfricaSouth AsiaSouth Asia (IDA & IBRD)SpainSri LankaSt. Kitts and NevisSt. LuciaSub-Saharan Africa Sub-Saharan Africa (excluding high income)Sub-Saharan Africa (IDA & IBRD countries)SurinameSwazilandSwedenSwitzerlandSyrian Arab RepublicTajikistanTanzaniaThailandTimor-LesteTogoTrinidad and TobagoTunisiaTurkeyUgandaUkraineUnited KingdomUnited StatesUpper middle incomeUruguayVanuatuVenezuela, RBVietnamWest Bank and GazaWorldYemen, Rep.ZambiaZimbabwe Timeline:
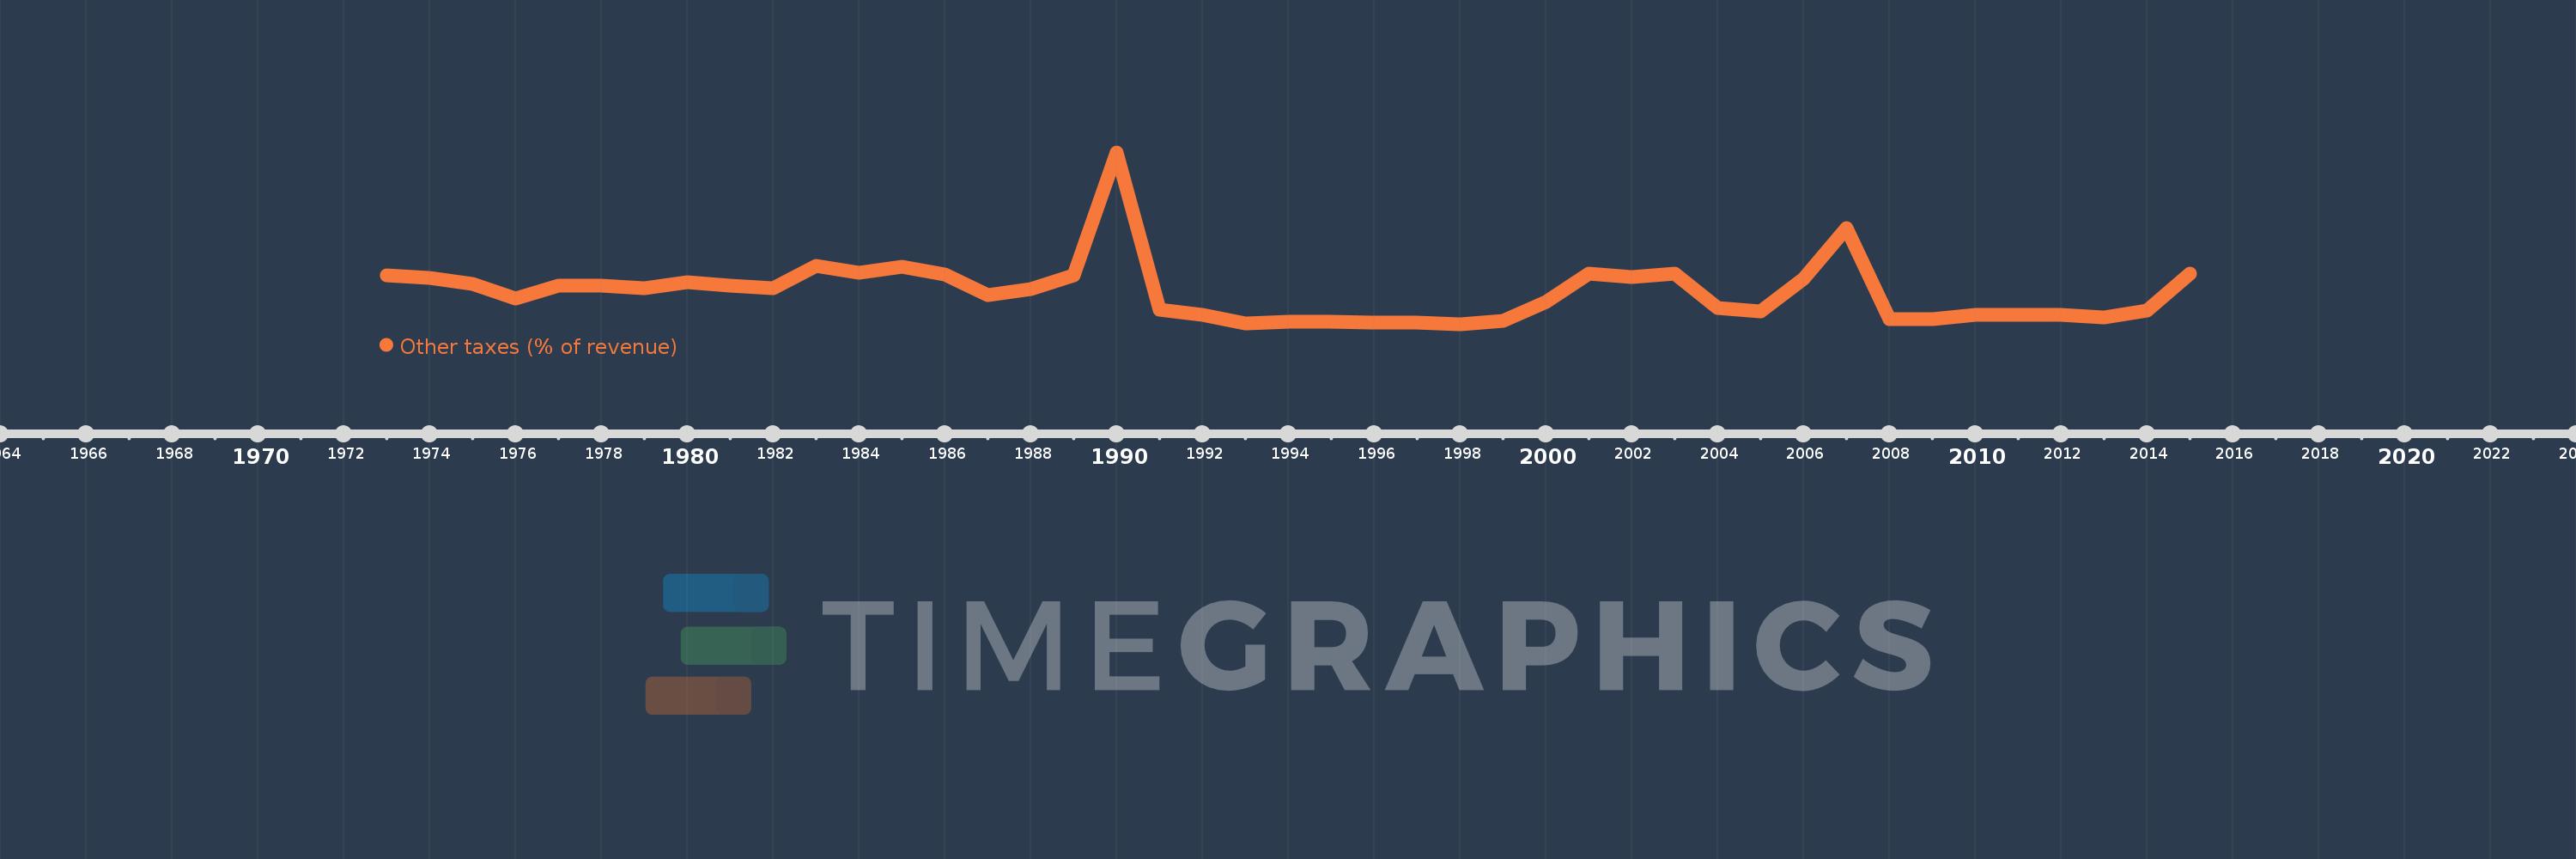
This timeline shows a graph from 1973 to 2015 of Dominican Republic. No data until 1972. Number of actual observations by date: 43.
Source name:
World Development Indicators
Source organization:
International Monetary Fund, Government Finance Statistics Yearbook and data files.
Categories, topics:
Public Sector
Last updated:
apr 23, 2017
Indicators value changes by year
At the date of observation
Value
Absolute change
Change from previous value
jan 1, 1973
1.407
+1.407
0.0%
jan 1, 1974
1.347
-0.06
-4.27%
jan 1, 1975
1.222
-0.125
-9.28%
jan 1, 1976
0.906
-0.316
-25.87%
jan 1, 1977
1.183
+0.277
30.58%
jan 1, 1978
1.192
+0.009
0.72%
jan 1, 1979
1.134
-0.058
-4.87%
jan 1, 1980
1.257
+0.123
10.88%
jan 1, 1981
1.195
-0.062
-4.96%
jan 1, 1982
1.138
-0.057
-4.73%
jan 1, 1983
1.625
+0.487
42.76%
jan 1, 1984
1.46
-0.165
-10.14%
jan 1, 1985
1.592
+0.132
9.05%
jan 1, 1986
1.438
-0.154
-9.69%
jan 1, 1987
0.985
-0.453
-31.53%
jan 1, 1988
1.118
+0.134
13.57%
jan 1, 1989
1.404
+0.285
25.52%
jan 1, 1990
4.112
+2.708
192.96%
jan 1, 1991
0.652
-3.459
-84.13%
jan 1, 1992
0.54
-0.113
-17.29%
jan 1, 1993
0.349
-0.191
-35.41%
jan 1, 1994
0.391
+0.043
12.26%
jan 1, 1995
0.391
+0.0
0.06%
jan 1, 1996
0.37
-0.022
-5.53%
jan 1, 1997
0.378
+0.008
2.09%
jan 1, 1998
0.339
-0.039
-10.26%
jan 1, 1999
0.42
+0.081
23.83%
jan 1, 2000
0.828
+0.409
97.39%
jan 1, 2001
1.445
+0.617
74.46%
jan 1, 2002
1.371
-0.073
-5.08%
jan 1, 2003
1.449
+0.078
5.67%
jan 1, 2004
0.689
-0.76
-52.43%
jan 1, 2005
0.615
-0.074
-10.77%
jan 1, 2006
1.335
+0.72
117.04%
jan 1, 2007
2.443
+1.108
82.97%
jan 1, 2008
0.456
-1.986
-81.31%
jan 1, 2009
0.457
+0.001
0.15%
jan 1, 2010
0.543
+0.086
18.82%
jan 1, 2011
0.549
+0.006
1.04%
jan 1, 2012
0.55
+0.001
0.2%
jan 1, 2013
0.496
-0.054
-9.77%
jan 1, 2014
0.639
+0.143
28.74%
jan 1, 2015
1.443
+0.804
125.93%
Ranking of countries by current statistics by years


Comments: