29
/
en
AIzaSyAYiBZKx7MnpbEhh9jyipgxe19OcubqV5w
April 1, 2024
256684
Sweden
SWE
true
2
1
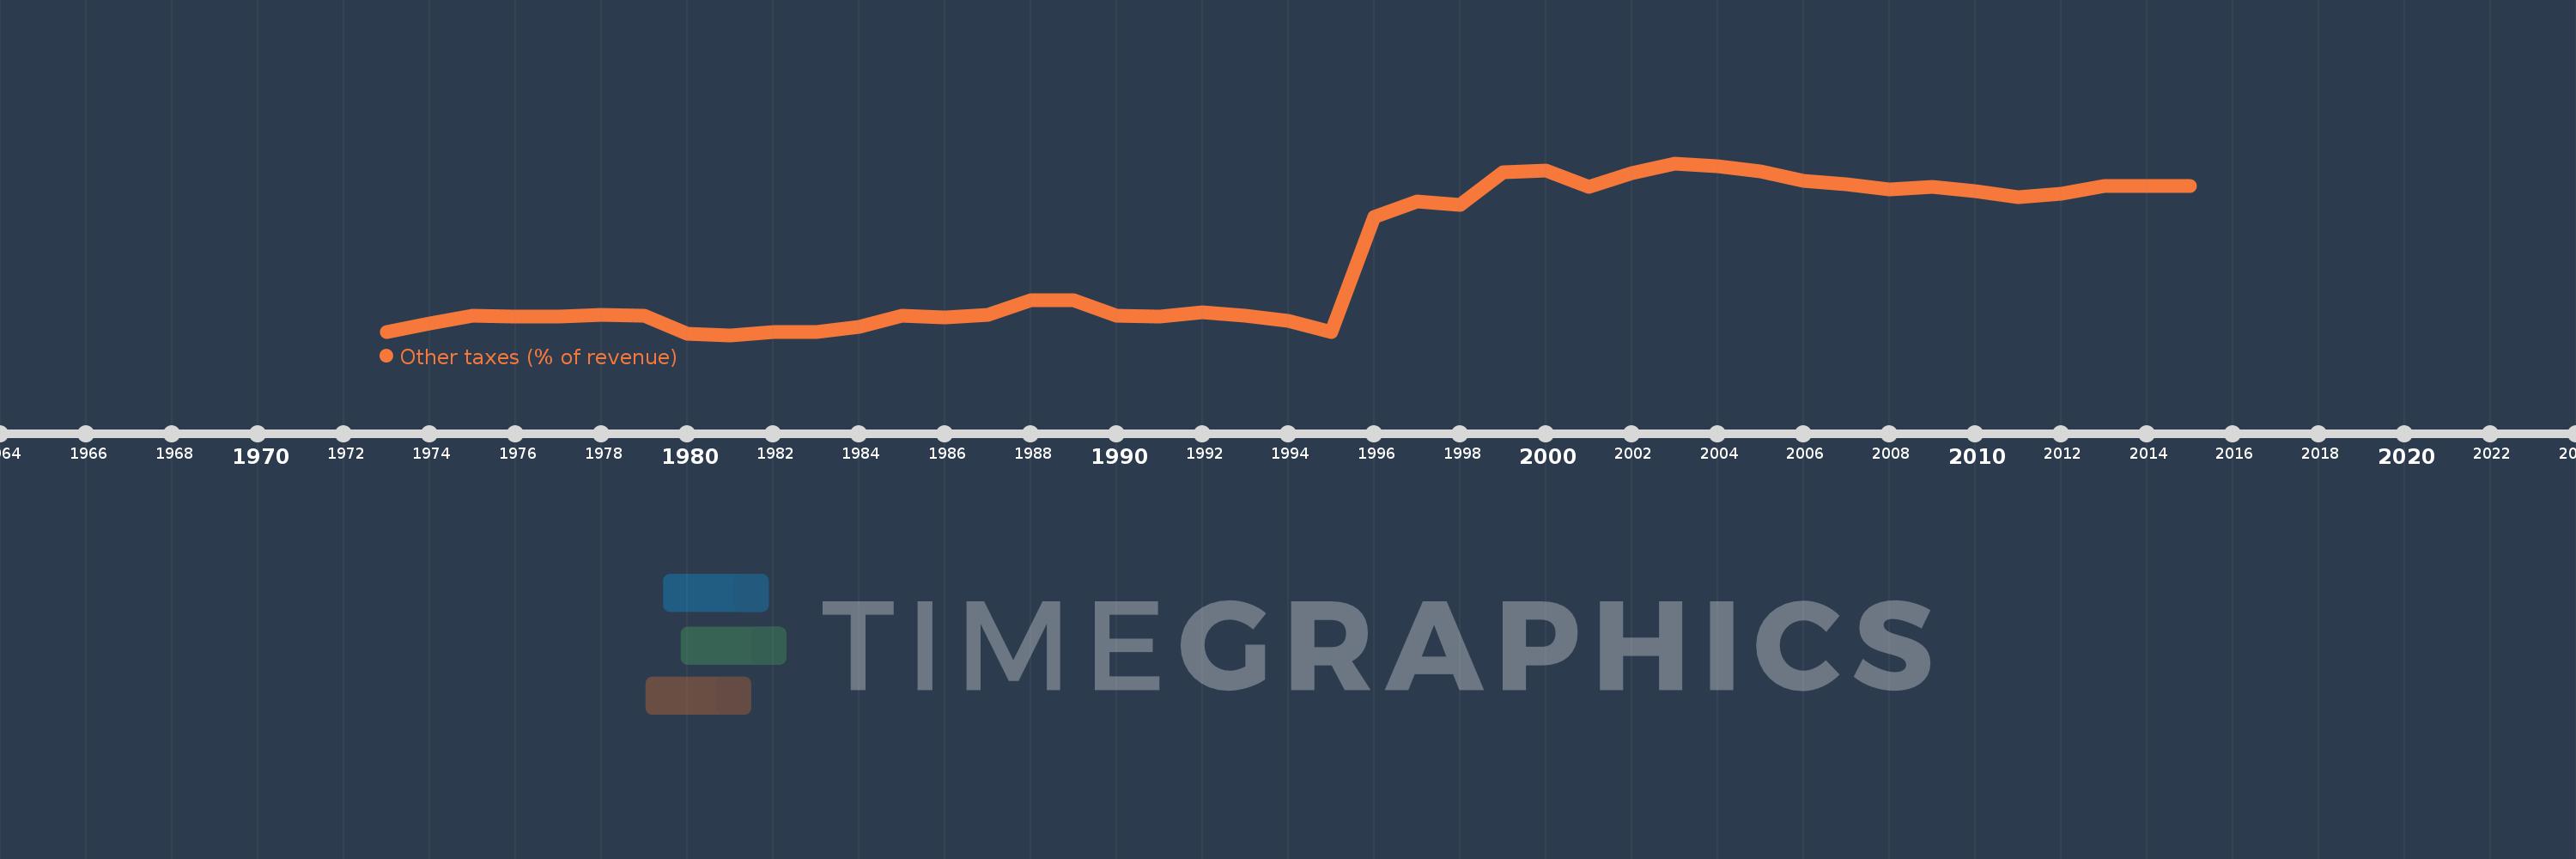
Other taxes (% of revenue)
2015,2014,2013,2012,2011,2010,2009,2008,2007,2006,2005,2004,2003,2002,2001,2000,1999,1998,1997,1996,1995,1994,1993,1992,1991,1990,1989,1988,1987,1986,1985,1984,1983,1982,1981,1980,1979,1978,1977,1976,1975,1974,1973
This statistics in other country:
AfghanistanAlbaniaAlgeriaAngolaAntigua and BarbudaArab WorldArgentinaArmeniaAustraliaAustriaAzerbaijanBahamas, TheBahrainBangladeshBarbadosBelarusBelgiumBelizeBeninBhutanBoliviaBosnia and HerzegovinaBotswanaBrazilBulgariaBurkina FasoBurundiCabo VerdeCambodiaCaribbean small statesCentral African RepublicCentral Europe and the BalticsChileChinaColombiaCongo, Dem. Rep.Congo, Rep.Costa RicaCote d'IvoireCroatiaCyprusCzech RepublicDenmarkDominicaDominican RepublicEarly-demographic dividendEast Asia & PacificEast Asia & Pacific (excluding high income)East Asia & Pacific (IDA & IBRD countries)Egypt, Arab Rep.El SalvadorEquatorial GuineaEstoniaEthiopiaEuro areaEurope & Central AsiaEurope & Central Asia (excluding high income)Europe & Central Asia (IDA & IBRD countries)European UnionFijiFinlandFranceGambia, TheGeorgiaGermanyGreeceGrenadaGuatemalaHeavily indebted poor countries (HIPC)High incomeHondurasHong Kong SAR, ChinaHungaryIBRD onlyIcelandIDA & IBRD totalIDA blendIDA onlyIDA totalIndiaIndonesiaIran, Islamic Rep.IraqIrelandIsraelItalyJamaicaJapanJordanKazakhstanKenyaKiribatiKorea, Rep.KuwaitKyrgyz RepublicLao PDRLate-demographic dividendLatin America & Caribbean Latin America & Caribbean (excluding high income)Latin America & the Caribbean (IDA & IBRD countries)LatviaLeast developed countries: UN classificationLebanonLesothoLiberiaLithuaniaLow & middle incomeLow incomeLower middle incomeLuxembourgMacao SAR, ChinaMacedonia, FYRMadagascarMalawiMalaysiaMaldivesMaliMaltaMauritiusMexicoMicronesia, Fed. Sts.Middle East & North AfricaMiddle East & North Africa (excluding high income)Middle East & North Africa (IDA & IBRD countries)Middle incomeMoldovaMongoliaMoroccoMozambiqueNamibiaNepalNetherlandsNew ZealandNicaraguaNorth AmericaNorwayOECD membersOmanOther small statesPakistanPanamaPapua New GuineaParaguayPeruPhilippinesPolandPortugalPost-demographic dividendPre-demographic dividendRomaniaRussian FederationRwandaSamoaSan MarinoSao Tome and PrincipeSenegalSerbiaSeychellesSierra LeoneSingaporeSlovak RepublicSloveniaSmall statesSolomon IslandsSouth AfricaSouth AsiaSouth Asia (IDA & IBRD)SpainSri LankaSt. Kitts and NevisSt. LuciaSub-Saharan Africa Sub-Saharan Africa (excluding high income)Sub-Saharan Africa (IDA & IBRD countries)SurinameSwazilandSwedenSwitzerlandSyrian Arab RepublicTajikistanTanzaniaThailandTimor-LesteTogoTrinidad and TobagoTunisiaTurkeyUgandaUkraineUnited KingdomUnited StatesUpper middle incomeUruguayVanuatuVenezuela, RBVietnamWest Bank and GazaWorldYemen, Rep.ZambiaZimbabwe Timeline:
This timeline shows a graph from 1973 to 2015 of Sweden. No data until 1972. Number of actual observations by date: 43.
Source name:
World Development Indicators
Source organization:
International Monetary Fund, Government Finance Statistics Yearbook and data files.
Categories, topics:
Public Sector
Last updated:
apr 23, 2017
Indicators value changes by year
Maximum:
33.256
jan 1, 2003
At the date of observation
Value
Absolute change
Change from previous value
jan 1, 1973
4.152
+4.152
0.0%
jan 1, 1974
5.603
+1.451
34.93%
jan 1, 1975
6.961
+1.359
24.25%
jan 1, 1976
6.765
-0.197
-2.82%
jan 1, 1977
6.763
-0.002
-0.03%
jan 1, 1978
7.161
+0.398
5.88%
jan 1, 1979
6.912
-0.248
-3.47%
jan 1, 1980
3.83
-3.082
-44.59%
jan 1, 1981
3.604
-0.226
-5.91%
jan 1, 1982
4.123
+0.519
14.41%
jan 1, 1983
4.073
-0.05
-1.22%
jan 1, 1984
5.077
+1.005
24.67%
jan 1, 1985
6.881
+1.803
35.52%
jan 1, 1986
6.652
-0.229
-3.32%
jan 1, 1987
7.151
+0.499
7.5%
jan 1, 1988
9.536
+2.385
33.35%
jan 1, 1989
9.597
+0.061
0.64%
jan 1, 1990
6.966
-2.631
-27.41%
jan 1, 1991
6.784
-0.181
-2.6%
jan 1, 1992
7.483
+0.699
10.3%
jan 1, 1993
6.87
-0.613
-8.19%
jan 1, 1994
6.072
-0.798
-11.62%
jan 1, 1995
4.079
-1.993
-32.82%
jan 1, 1996
24.048
+19.969
489.56%
jan 1, 1997
26.605
+2.557
10.63%
jan 1, 1998
26.07
-0.536
-2.01%
jan 1, 1999
31.673
+5.603
21.49%
jan 1, 2000
32.064
+0.392
1.24%
jan 1, 2001
29.215
-2.849
-8.89%
jan 1, 2002
31.496
+2.281
7.81%
jan 1, 2003
33.256
+1.76
5.59%
jan 1, 2004
32.737
-0.519
-1.56%
jan 1, 2005
31.782
-0.955
-2.92%
jan 1, 2006
30.164
-1.617
-5.09%
jan 1, 2007
29.679
-0.486
-1.61%
jan 1, 2008
28.676
-1.003
-3.38%
jan 1, 2009
29.142
+0.467
1.63%
jan 1, 2010
28.489
-0.653
-2.24%
jan 1, 2011
27.473
-1.016
-3.57%
jan 1, 2012
28.036
+0.563
2.05%
jan 1, 2013
29.308
+1.272
4.54%
jan 1, 2014
29.297
-0.011
-0.04%
jan 1, 2015
29.38
+0.083
0.28%
Ranking of countries by current statistics by years


Comments: