29
/
en
AIzaSyAYiBZKx7MnpbEhh9jyipgxe19OcubqV5w
April 1, 2024
152920
Hungary
HUN
true
2
1
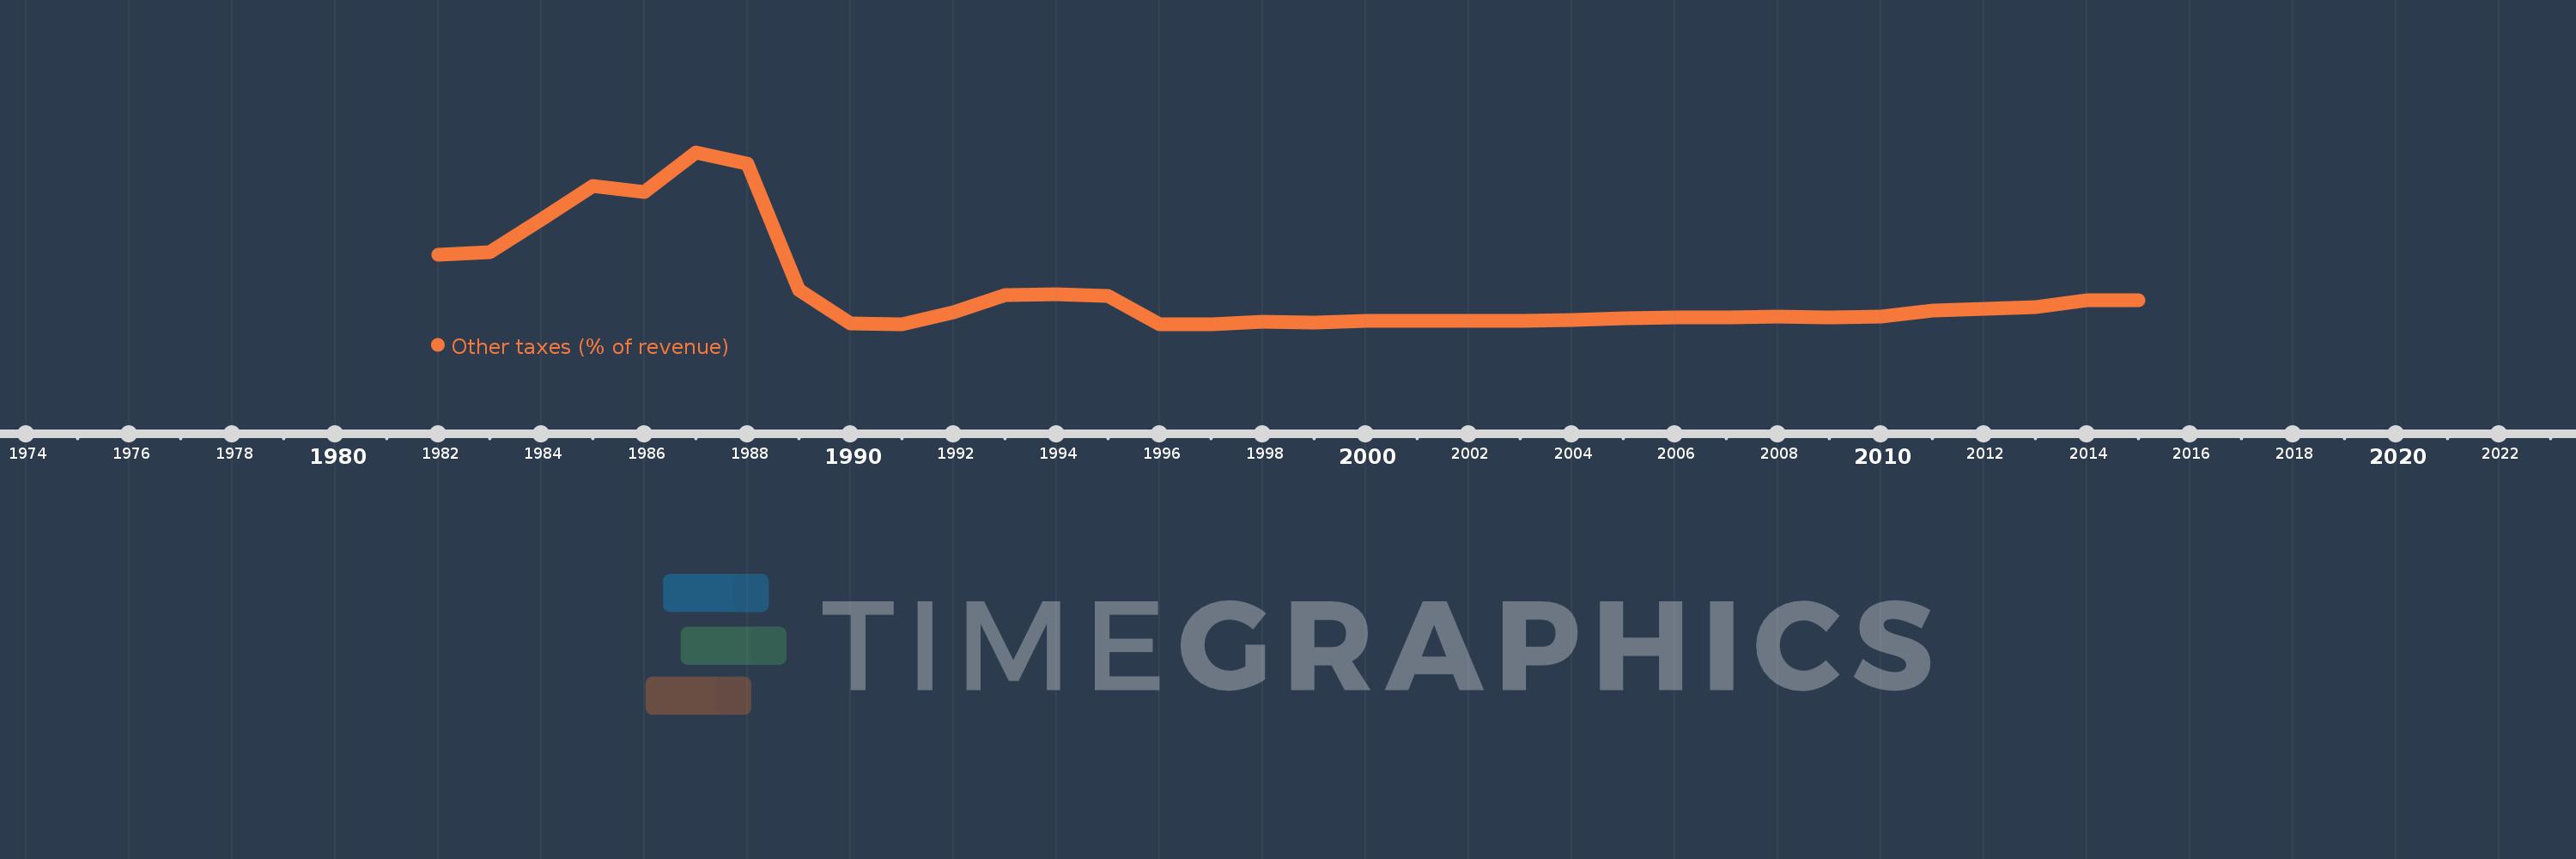
Other taxes (% of revenue)
2015,2014,2013,2012,2011,2010,2009,2008,2007,2006,2005,2004,2003,2002,2001,2000,1999,1998,1997,1996,1995,1994,1993,1992,1991,1990,1989,1988,1987,1986,1985,1984,1983,1982
This statistics in other country:
AfghanistanAlbaniaAlgeriaAngolaAntigua and BarbudaArab WorldArgentinaArmeniaAustraliaAustriaAzerbaijanBahamas, TheBahrainBangladeshBarbadosBelarusBelgiumBelizeBeninBhutanBoliviaBosnia and HerzegovinaBotswanaBrazilBulgariaBurkina FasoBurundiCabo VerdeCambodiaCaribbean small statesCentral African RepublicCentral Europe and the BalticsChileChinaColombiaCongo, Dem. Rep.Congo, Rep.Costa RicaCote d'IvoireCroatiaCyprusCzech RepublicDenmarkDominicaDominican RepublicEarly-demographic dividendEast Asia & PacificEast Asia & Pacific (excluding high income)East Asia & Pacific (IDA & IBRD countries)Egypt, Arab Rep.El SalvadorEquatorial GuineaEstoniaEthiopiaEuro areaEurope & Central AsiaEurope & Central Asia (excluding high income)Europe & Central Asia (IDA & IBRD countries)European UnionFijiFinlandFranceGambia, TheGeorgiaGermanyGreeceGrenadaGuatemalaHeavily indebted poor countries (HIPC)High incomeHondurasHong Kong SAR, ChinaHungaryIBRD onlyIcelandIDA & IBRD totalIDA blendIDA onlyIDA totalIndiaIndonesiaIran, Islamic Rep.IraqIrelandIsraelItalyJamaicaJapanJordanKazakhstanKenyaKiribatiKorea, Rep.KuwaitKyrgyz RepublicLao PDRLate-demographic dividendLatin America & Caribbean Latin America & Caribbean (excluding high income)Latin America & the Caribbean (IDA & IBRD countries)LatviaLeast developed countries: UN classificationLebanonLesothoLiberiaLithuaniaLow & middle incomeLow incomeLower middle incomeLuxembourgMacao SAR, ChinaMacedonia, FYRMadagascarMalawiMalaysiaMaldivesMaliMaltaMauritiusMexicoMicronesia, Fed. Sts.Middle East & North AfricaMiddle East & North Africa (excluding high income)Middle East & North Africa (IDA & IBRD countries)Middle incomeMoldovaMongoliaMoroccoMozambiqueNamibiaNepalNetherlandsNew ZealandNicaraguaNorth AmericaNorwayOECD membersOmanOther small statesPakistanPanamaPapua New GuineaParaguayPeruPhilippinesPolandPortugalPost-demographic dividendPre-demographic dividendRomaniaRussian FederationRwandaSamoaSan MarinoSao Tome and PrincipeSenegalSerbiaSeychellesSierra LeoneSingaporeSlovak RepublicSloveniaSmall statesSolomon IslandsSouth AfricaSouth AsiaSouth Asia (IDA & IBRD)SpainSri LankaSt. Kitts and NevisSt. LuciaSub-Saharan Africa Sub-Saharan Africa (excluding high income)Sub-Saharan Africa (IDA & IBRD countries)SurinameSwazilandSwedenSwitzerlandSyrian Arab RepublicTajikistanTanzaniaThailandTimor-LesteTogoTrinidad and TobagoTunisiaTurkeyUgandaUkraineUnited KingdomUnited StatesUpper middle incomeUruguayVanuatuVenezuela, RBVietnamWest Bank and GazaWorldYemen, Rep.ZambiaZimbabwe Timeline:
This timeline shows a graph from 1982 to 2015 of Hungary. No data until 1981. Number of actual observations by date: 34.
Source name:
World Development Indicators
Source organization:
International Monetary Fund, Government Finance Statistics Yearbook and data files.
Categories, topics:
Public Sector
Last updated:
apr 23, 2017
Indicators value changes by year
Maximum:
11.701
jan 1, 1987
At the date of observation
Value
Absolute change
Change from previous value
jan 1, 1982
4.822
+4.822
0.0%
jan 1, 1983
5.015
+0.192
3.99%
jan 1, 1984
7.224
+2.209
44.05%
jan 1, 1985
9.473
+2.249
31.13%
jan 1, 1986
9.059
-0.414
-4.37%
jan 1, 1987
11.701
+2.642
29.16%
jan 1, 1988
10.933
-0.768
-6.56%
jan 1, 1989
2.469
-8.464
-77.42%
jan 1, 1990
0.238
-2.23
-90.35%
jan 1, 1991
0.208
-0.03
-12.71%
jan 1, 1992
0.971
+0.763
367.09%
jan 1, 1993
2.152
+1.18
121.5%
jan 1, 1994
2.186
+0.035
1.62%
jan 1, 1995
2.081
-0.105
-4.82%
jan 1, 1996
0.189
-1.892
-90.94%
jan 1, 1997
0.199
+0.01
5.38%
jan 1, 1998
0.371
+0.172
86.65%
jan 1, 1999
0.316
-0.055
-14.87%
jan 1, 2000
0.386
+0.07
22.27%
jan 1, 2001
0.388
+0.002
0.52%
jan 1, 2002
0.417
+0.029
7.36%
jan 1, 2003
0.44
+0.023
5.55%
jan 1, 2004
0.455
+0.015
3.41%
jan 1, 2005
0.57
+0.115
25.22%
jan 1, 2006
0.652
+0.082
14.39%
jan 1, 2007
0.649
-0.002
-0.38%
jan 1, 2008
0.72
+0.071
10.93%
jan 1, 2009
0.664
-0.056
-7.83%
jan 1, 2010
0.701
+0.038
5.66%
jan 1, 2011
1.087
+0.386
55.02%
jan 1, 2012
1.2
+0.113
10.39%
jan 1, 2013
1.357
+0.157
13.04%
jan 1, 2014
1.807
+0.45
33.16%
jan 1, 2015
1.773
-0.033
-1.84%
Ranking of countries by current statistics by years


Comments: