29
/
en
AIzaSyAYiBZKx7MnpbEhh9jyipgxe19OcubqV5w
April 1, 2024
240815
Singapore
SGP
true
2
1
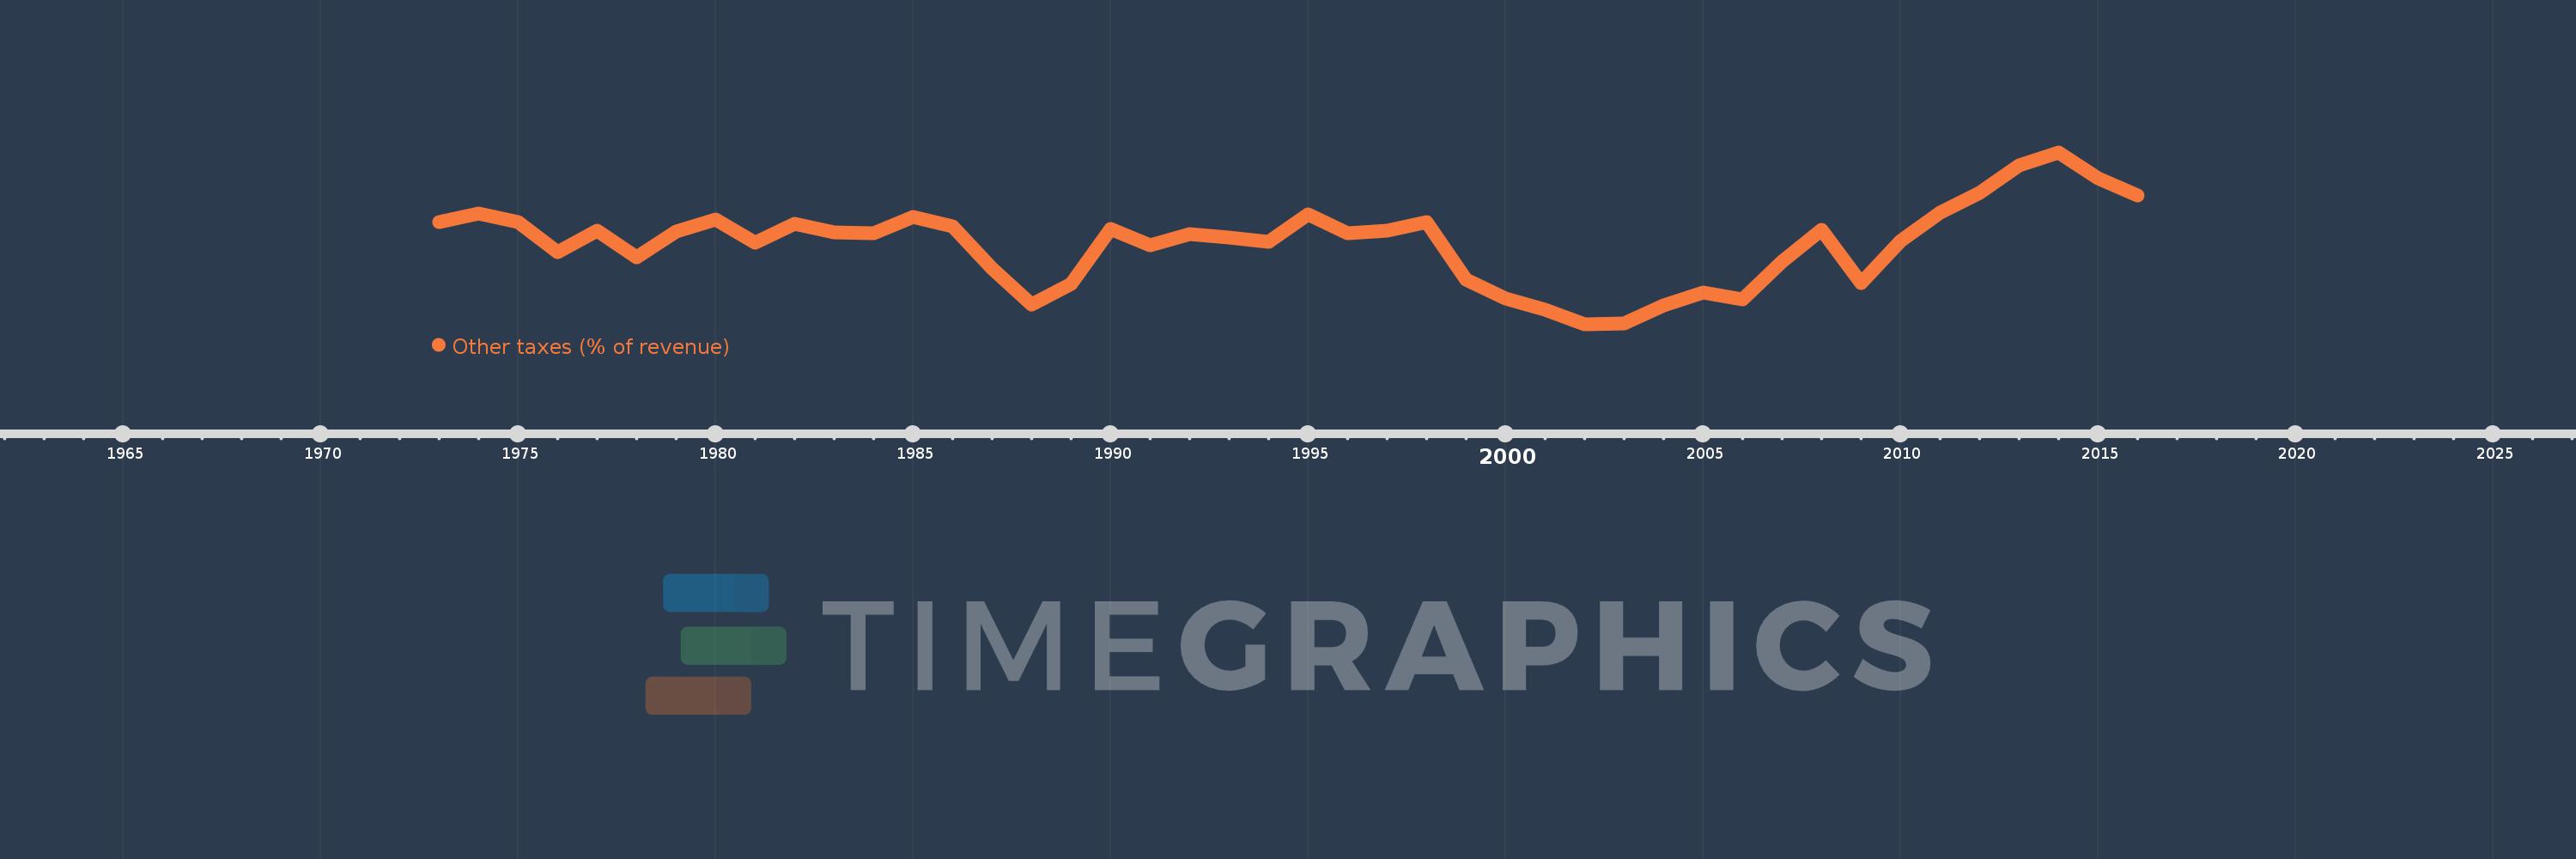
Other taxes (% of revenue)
2016,2015,2014,2013,2012,2011,2010,2009,2008,2007,2006,2005,2004,2003,2002,2001,2000,1999,1998,1997,1996,1995,1994,1993,1992,1991,1990,1989,1988,1987,1986,1985,1984,1983,1982,1981,1980,1979,1978,1977,1976,1975,1974,1973
This statistics in other country:
AfghanistanAlbaniaAlgeriaAngolaAntigua and BarbudaArab WorldArgentinaArmeniaAustraliaAustriaAzerbaijanBahamas, TheBahrainBangladeshBarbadosBelarusBelgiumBelizeBeninBhutanBoliviaBosnia and HerzegovinaBotswanaBrazilBulgariaBurkina FasoBurundiCabo VerdeCambodiaCaribbean small statesCentral African RepublicCentral Europe and the BalticsChileChinaColombiaCongo, Dem. Rep.Congo, Rep.Costa RicaCote d'IvoireCroatiaCyprusCzech RepublicDenmarkDominicaDominican RepublicEarly-demographic dividendEast Asia & PacificEast Asia & Pacific (excluding high income)East Asia & Pacific (IDA & IBRD countries)Egypt, Arab Rep.El SalvadorEquatorial GuineaEstoniaEthiopiaEuro areaEurope & Central AsiaEurope & Central Asia (excluding high income)Europe & Central Asia (IDA & IBRD countries)European UnionFijiFinlandFranceGambia, TheGeorgiaGermanyGreeceGrenadaGuatemalaHeavily indebted poor countries (HIPC)High incomeHondurasHong Kong SAR, ChinaHungaryIBRD onlyIcelandIDA & IBRD totalIDA blendIDA onlyIDA totalIndiaIndonesiaIran, Islamic Rep.IraqIrelandIsraelItalyJamaicaJapanJordanKazakhstanKenyaKiribatiKorea, Rep.KuwaitKyrgyz RepublicLao PDRLate-demographic dividendLatin America & Caribbean Latin America & Caribbean (excluding high income)Latin America & the Caribbean (IDA & IBRD countries)LatviaLeast developed countries: UN classificationLebanonLesothoLiberiaLithuaniaLow & middle incomeLow incomeLower middle incomeLuxembourgMacao SAR, ChinaMacedonia, FYRMadagascarMalawiMalaysiaMaldivesMaliMaltaMauritiusMexicoMicronesia, Fed. Sts.Middle East & North AfricaMiddle East & North Africa (excluding high income)Middle East & North Africa (IDA & IBRD countries)Middle incomeMoldovaMongoliaMoroccoMozambiqueNamibiaNepalNetherlandsNew ZealandNicaraguaNorth AmericaNorwayOECD membersOmanOther small statesPakistanPanamaPapua New GuineaParaguayPeruPhilippinesPolandPortugalPost-demographic dividendPre-demographic dividendRomaniaRussian FederationRwandaSamoaSan MarinoSao Tome and PrincipeSenegalSerbiaSeychellesSierra LeoneSingaporeSlovak RepublicSloveniaSmall statesSolomon IslandsSouth AfricaSouth AsiaSouth Asia (IDA & IBRD)SpainSri LankaSt. Kitts and NevisSt. LuciaSub-Saharan Africa Sub-Saharan Africa (excluding high income)Sub-Saharan Africa (IDA & IBRD countries)SurinameSwazilandSwedenSwitzerlandSyrian Arab RepublicTajikistanTanzaniaThailandTimor-LesteTogoTrinidad and TobagoTunisiaTurkeyUgandaUkraineUnited KingdomUnited StatesUpper middle incomeUruguayVanuatuVenezuela, RBVietnamWest Bank and GazaWorldYemen, Rep.ZambiaZimbabwe Timeline:
This timeline shows a graph from 1973 to 2016 of Singapore. No data until 1972. Number of actual observations by date: 44.
Source name:
World Development Indicators
Source organization:
International Monetary Fund, Government Finance Statistics Yearbook and data files.
Categories, topics:
Public Sector
Last updated:
apr 23, 2017
Indicators value changes by year
Maximum:
20.136
jan 1, 2014
At the date of observation
Value
Absolute change
Change from previous value
jan 1, 1973
15.363
+15.363
0.0%
jan 1, 1974
15.93
+0.567
3.69%
jan 1, 1975
15.385
-0.546
-3.43%
jan 1, 1976
13.318
-2.066
-13.43%
jan 1, 1977
14.752
+1.433
10.76%
jan 1, 1978
12.946
-1.805
-12.24%
jan 1, 1979
14.708
+1.762
13.61%
jan 1, 1980
15.531
+0.823
5.6%
jan 1, 1981
13.92
-1.611
-10.37%
jan 1, 1982
15.237
+1.317
9.46%
jan 1, 1983
14.645
-0.591
-3.88%
jan 1, 1984
14.604
-0.041
-0.28%
jan 1, 1985
15.702
+1.097
7.51%
jan 1, 1986
15.063
-0.639
-4.07%
jan 1, 1987
12.179
-2.884
-19.14%
jan 1, 1988
9.709
-2.471
-20.29%
jan 1, 1989
11.129
+1.42
14.63%
jan 1, 1990
14.863
+3.734
33.56%
jan 1, 1991
13.77
-1.093
-7.35%
jan 1, 1992
14.539
+0.769
5.58%
jan 1, 1993
14.33
-0.209
-1.44%
jan 1, 1994
13.995
-0.335
-2.34%
jan 1, 1995
15.919
+1.924
13.75%
jan 1, 1996
14.566
-1.353
-8.5%
jan 1, 1997
14.793
+0.227
1.56%
jan 1, 1998
15.36
+0.567
3.83%
jan 1, 1999
11.406
-3.954
-25.74%
jan 1, 2000
10.104
-1.302
-11.41%
jan 1, 2001
9.35
-0.755
-7.47%
jan 1, 2002
8.36
-0.989
-10.58%
jan 1, 2003
8.407
+0.047
0.56%
jan 1, 2004
9.665
+1.258
14.96%
jan 1, 2005
10.532
+0.866
8.96%
jan 1, 2006
10.061
-0.47
-4.47%
jan 1, 2007
12.651
+2.59
25.74%
jan 1, 2008
14.84
+2.189
17.3%
jan 1, 2009
11.201
-3.639
-24.52%
jan 1, 2010
14.084
+2.883
25.74%
jan 1, 2011
16.013
+1.929
13.69%
jan 1, 2012
17.363
+1.35
8.43%
jan 1, 2013
19.27
+1.907
10.98%
jan 1, 2014
20.136
+0.866
4.49%
jan 1, 2015
18.39
-1.746
-8.67%
jan 1, 2016
17.19
-1.2
-6.52%
Ranking of countries by current statistics by years


Comments: