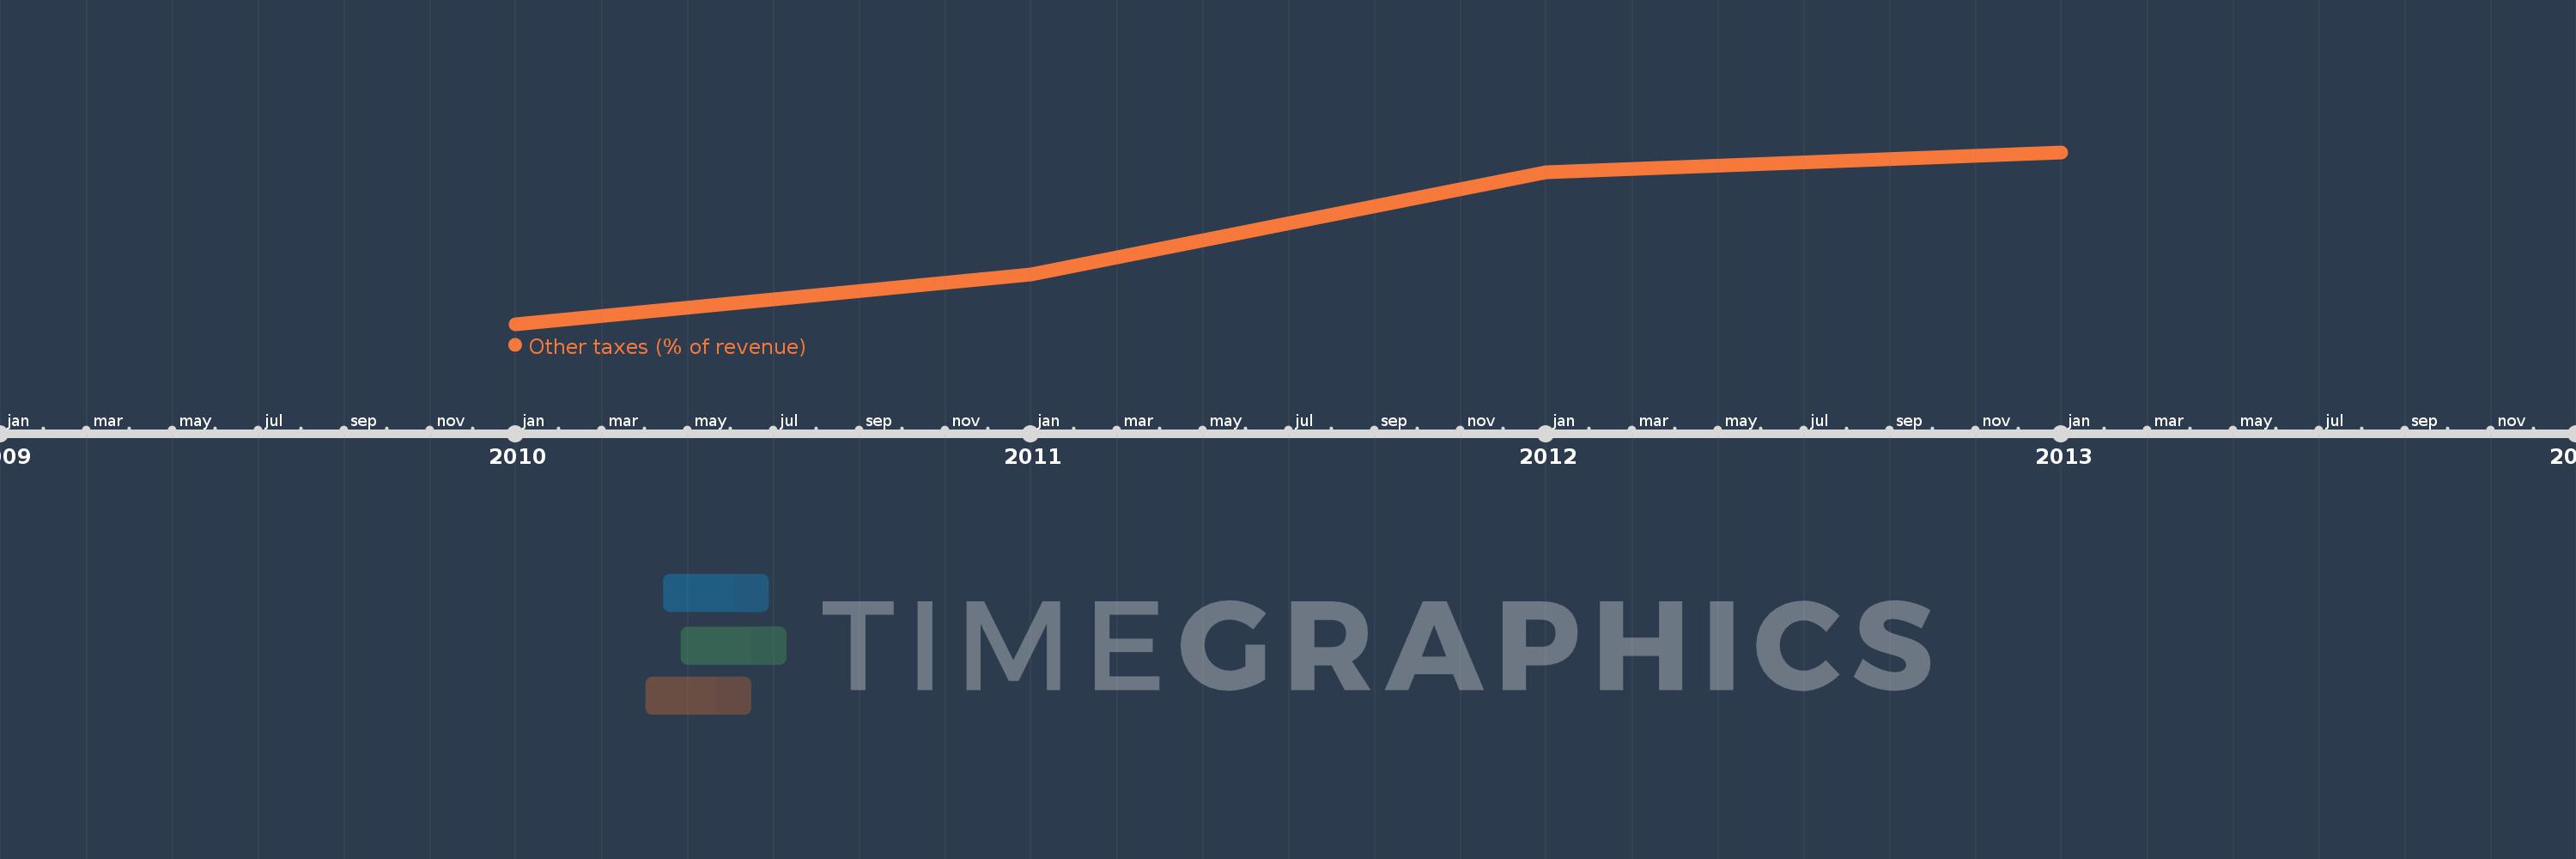
This timeline shows a graph from 2010 to 2013 of Sub-Saharan Africa (excluding high income). No data until 2009. Number of actual observations by date: 4.
Source name:
World Development Indicators
Source organization:
International Monetary Fund, Government Finance Statistics Yearbook and data files.
Categories, topics:
Public Sector
Last updated:
apr 23, 2017
Indicators value changes by year
Meaning:
1.392
Minimum:
1.109
jan 1, 2010
Maximum:
1.629
jan 1, 2013
At the date of observation
Value
Absolute change
Change from the previous value
jan 1, 2010
1.109
+1.109
0.0%
jan 1, 2011
1.26
+0.151
13.62%
jan 1, 2012
1.568
+0.308
24.45%
jan 1, 2013
1.629
+0.061
3.89%
Ranking of countries by current statistics by years
