29
/
en
AIzaSyAYiBZKx7MnpbEhh9jyipgxe19OcubqV5w
April 1, 2024
73405
Australia
AUS
true
2
1
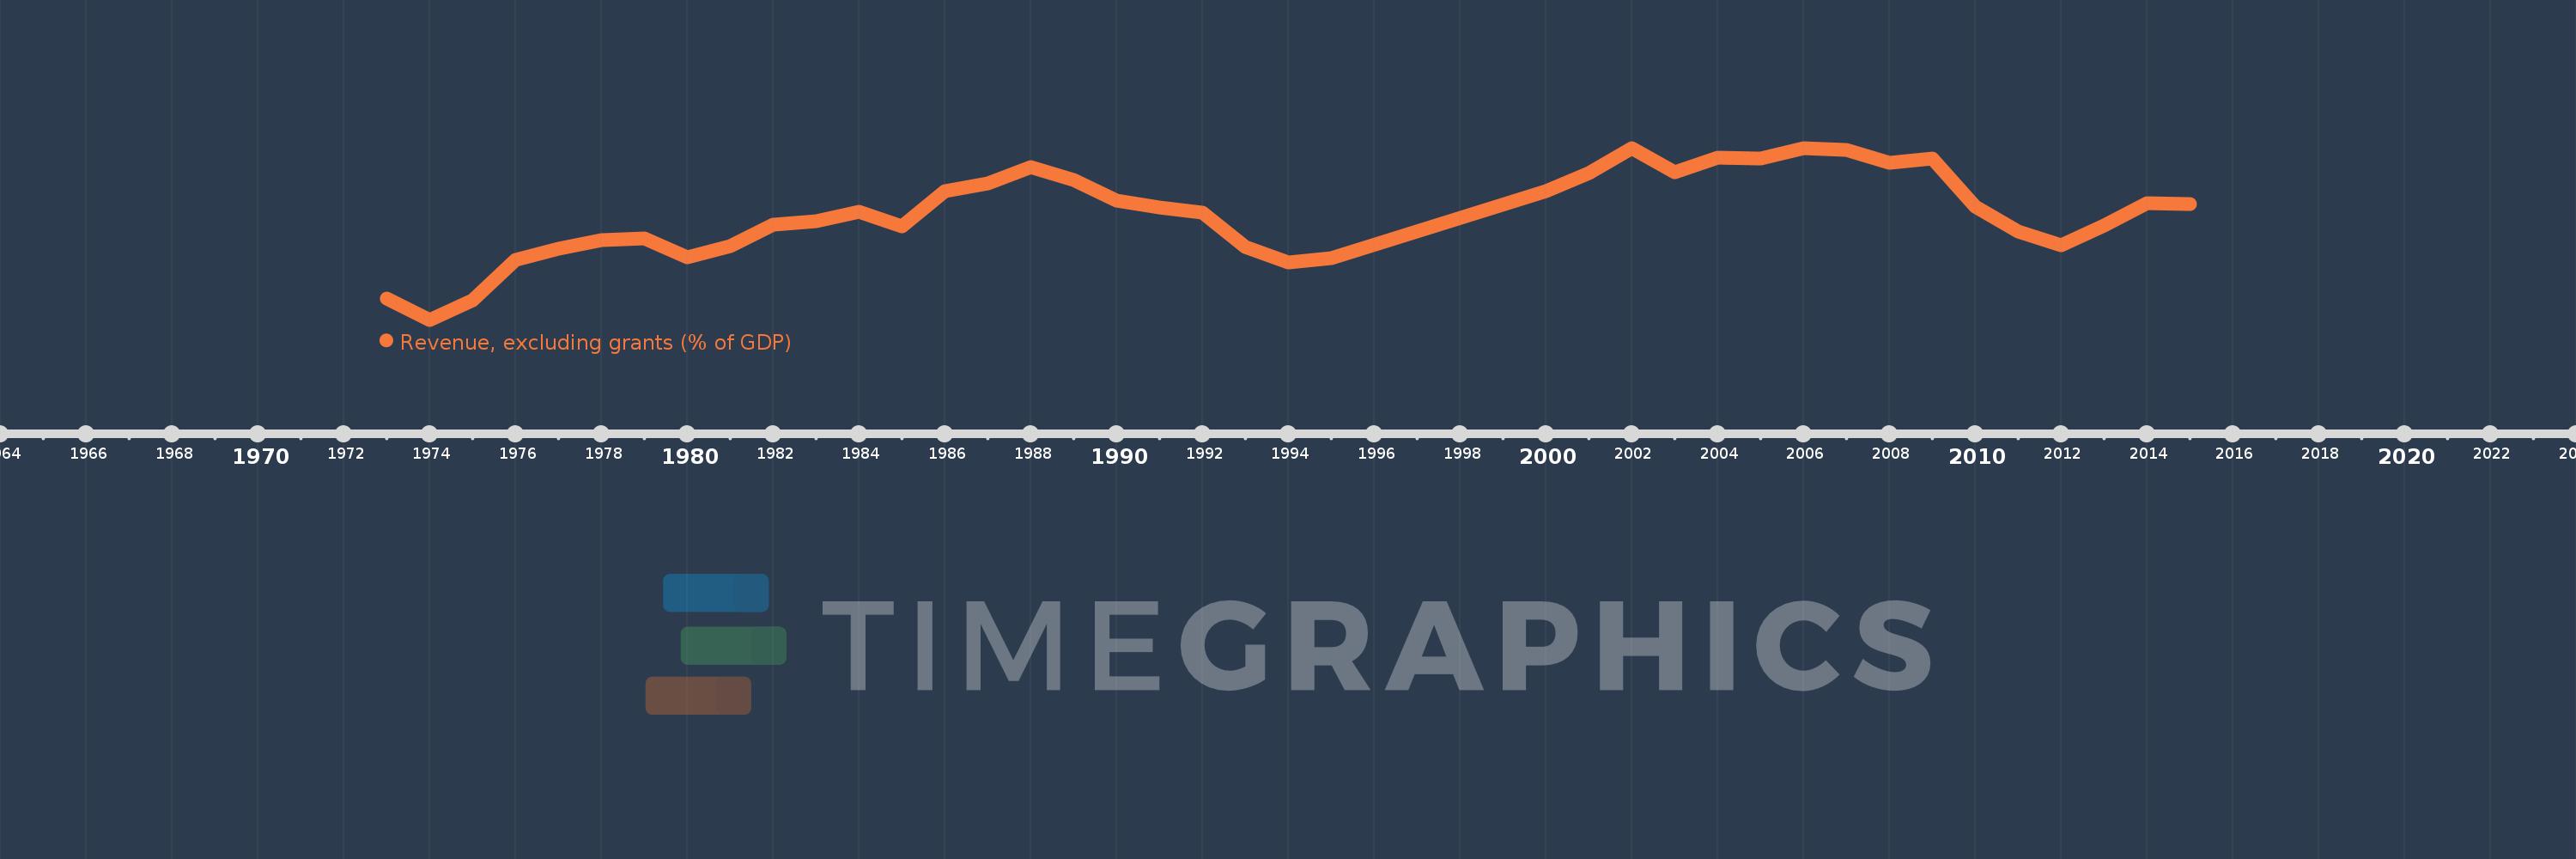
Revenue, excluding grants (% of GDP)
2015,2014,2013,2012,2011,2010,2009,2008,2007,2006,2005,2004,2003,2002,2001,2000,1995,1994,1993,1992,1991,1990,1989,1988,1987,1986,1985,1984,1983,1982,1981,1980,1979,1978,1977,1976,1975,1974,1973
This statistics in other country:
AfghanistanAlbaniaAlgeriaAngolaAntigua and BarbudaArgentinaArmeniaAustraliaAustriaAzerbaijanBahamas, TheBahrainBangladeshBarbadosBelarusBelgiumBelizeBeninBhutanBoliviaBosnia and HerzegovinaBotswanaBrazilBulgariaBurkina FasoBurundiCabo VerdeCambodiaCanadaCaribbean small statesCentral African RepublicCentral Europe and the BalticsChileChinaColombiaCongo, Dem. Rep.Congo, Rep.Costa RicaCote d'IvoireCroatiaCyprusCzech RepublicDenmarkDominicaDominican RepublicEarly-demographic dividendEast Asia & PacificEast Asia & Pacific (excluding high income)East Asia & Pacific (IDA & IBRD countries)Egypt, Arab Rep.El SalvadorEquatorial GuineaEstoniaEthiopiaEuro areaEurope & Central AsiaEurope & Central Asia (excluding high income)Europe & Central Asia (IDA & IBRD countries)European UnionFijiFinlandFranceGambia, TheGeorgiaGermanyGhanaGreeceGrenadaGuatemalaHeavily indebted poor countries (HIPC)High incomeHondurasHong Kong SAR, ChinaHungaryIBRD onlyIcelandIDA & IBRD totalIDA blendIDA onlyIDA totalIndiaIndonesiaIran, Islamic Rep.IraqIrelandIsraelItalyJamaicaJapanJordanKazakhstanKenyaKiribatiKorea, Rep.KuwaitKyrgyz RepublicLao PDRLate-demographic dividendLatin America & Caribbean Latin America & Caribbean (excluding high income)Latin America & the Caribbean (IDA & IBRD countries)LatviaLeast developed countries: UN classificationLebanonLesothoLiberiaLithuaniaLow & middle incomeLow incomeLower middle incomeLuxembourgMacao SAR, ChinaMacedonia, FYRMadagascarMalawiMalaysiaMaldivesMaliMaltaMauritiusMexicoMicronesia, Fed. Sts.Middle East & North Africa (excluding high income)Middle East & North Africa (IDA & IBRD countries)Middle incomeMoldovaMongoliaMoroccoMozambiqueMyanmarNamibiaNepalNetherlandsNew ZealandNicaraguaNigeriaNorth AmericaNorwayOECD membersOmanOther small statesPacific island small statesPakistanPanamaPapua New GuineaParaguayPeruPhilippinesPolandPortugalPost-demographic dividendPre-demographic dividendQatarRomaniaRussian FederationRwandaSamoaSan MarinoSao Tome and PrincipeSenegalSerbiaSeychellesSierra LeoneSingaporeSlovak RepublicSloveniaSmall statesSolomon IslandsSouth AfricaSouth AsiaSouth Asia (IDA & IBRD)SpainSri LankaSt. Kitts and NevisSt. LuciaSt. Vincent and the GrenadinesSub-Saharan Africa Sub-Saharan Africa (excluding high income)Sub-Saharan Africa (IDA & IBRD countries)SurinameSwazilandSwedenSwitzerlandSyrian Arab RepublicTajikistanTanzaniaThailandTimor-LesteTogoTrinidad and TobagoTunisiaTurkeyUgandaUkraineUnited Arab EmiratesUnited KingdomUnited StatesUpper middle incomeUruguayVanuatuVenezuela, RBVietnamWest Bank and GazaWorldYemen, Rep.ZambiaZimbabwe Timeline:
This timeline shows a graph from 1973 to 2015 of Australia. No data until 1972. Number of actual observations by date: 39.
Source name:
World Development Indicators
Source organization:
International Monetary Fund, Government Finance Statistics Yearbook and data files, and World Bank and OECD GDP estimates.
Categories, topics:
Economy & Growth, Public Sector
Last updated:
apr 23, 2017
Indicators value changes by year
Minimum:
19.495
jan 1, 1974
Maximum:
27.079
jan 1, 2006
At the date of observation
Value
Absolute change
Change from previous value
jan 1, 1973
20.443
+20.443
0.0%
jan 1, 1974
19.495
-0.947
-4.63%
jan 1, 1975
20.342
+0.847
4.34%
jan 1, 1976
22.123
+1.781
8.75%
jan 1, 1977
22.631
+0.508
2.3%
jan 1, 1978
23.018
+0.386
1.71%
jan 1, 1979
23.101
+0.084
0.36%
jan 1, 1980
22.266
-0.835
-3.61%
jan 1, 1981
22.752
+0.486
2.18%
jan 1, 1982
23.691
+0.938
4.12%
jan 1, 1983
23.85
+0.159
0.67%
jan 1, 1984
24.269
+0.419
1.76%
jan 1, 1985
23.612
-0.657
-2.71%
jan 1, 1986
25.157
+1.545
6.54%
jan 1, 1987
25.509
+0.351
1.4%
jan 1, 1988
26.219
+0.711
2.79%
jan 1, 1989
25.664
-0.555
-2.12%
jan 1, 1990
24.756
-0.908
-3.54%
jan 1, 1991
24.469
-0.287
-1.16%
jan 1, 1992
24.236
-0.233
-0.95%
jan 1, 1993
22.723
-1.513
-6.24%
jan 1, 1994
22.021
-0.703
-3.09%
jan 1, 1995
22.216
+0.195
0.89%
jan 1, 2000
25.156
+2.94
13.24%
jan 1, 2001
25.96
+0.804
3.2%
jan 1, 2002
27.059
+1.099
4.23%
jan 1, 2003
26.024
-1.035
-3.82%
jan 1, 2004
26.661
+0.637
2.45%
jan 1, 2005
26.602
-0.059
-0.22%
jan 1, 2006
27.079
+0.478
1.8%
jan 1, 2007
26.978
-0.102
-0.38%
jan 1, 2008
26.431
-0.546
-2.03%
jan 1, 2009
26.596
+0.165
0.62%
jan 1, 2010
24.502
-2.094
-7.87%
jan 1, 2011
23.381
-1.121
-4.58%
jan 1, 2012
22.789
-0.592
-2.53%
jan 1, 2013
23.656
+0.867
3.8%
jan 1, 2014
24.623
+0.967
4.09%
jan 1, 2015
24.615
-0.008
-0.03%
Ranking of countries by current statistics by years


Comments: