29
/
en
AIzaSyAYiBZKx7MnpbEhh9jyipgxe19OcubqV5w
April 1, 2024
189588
Maldives
MDV
true
2
1
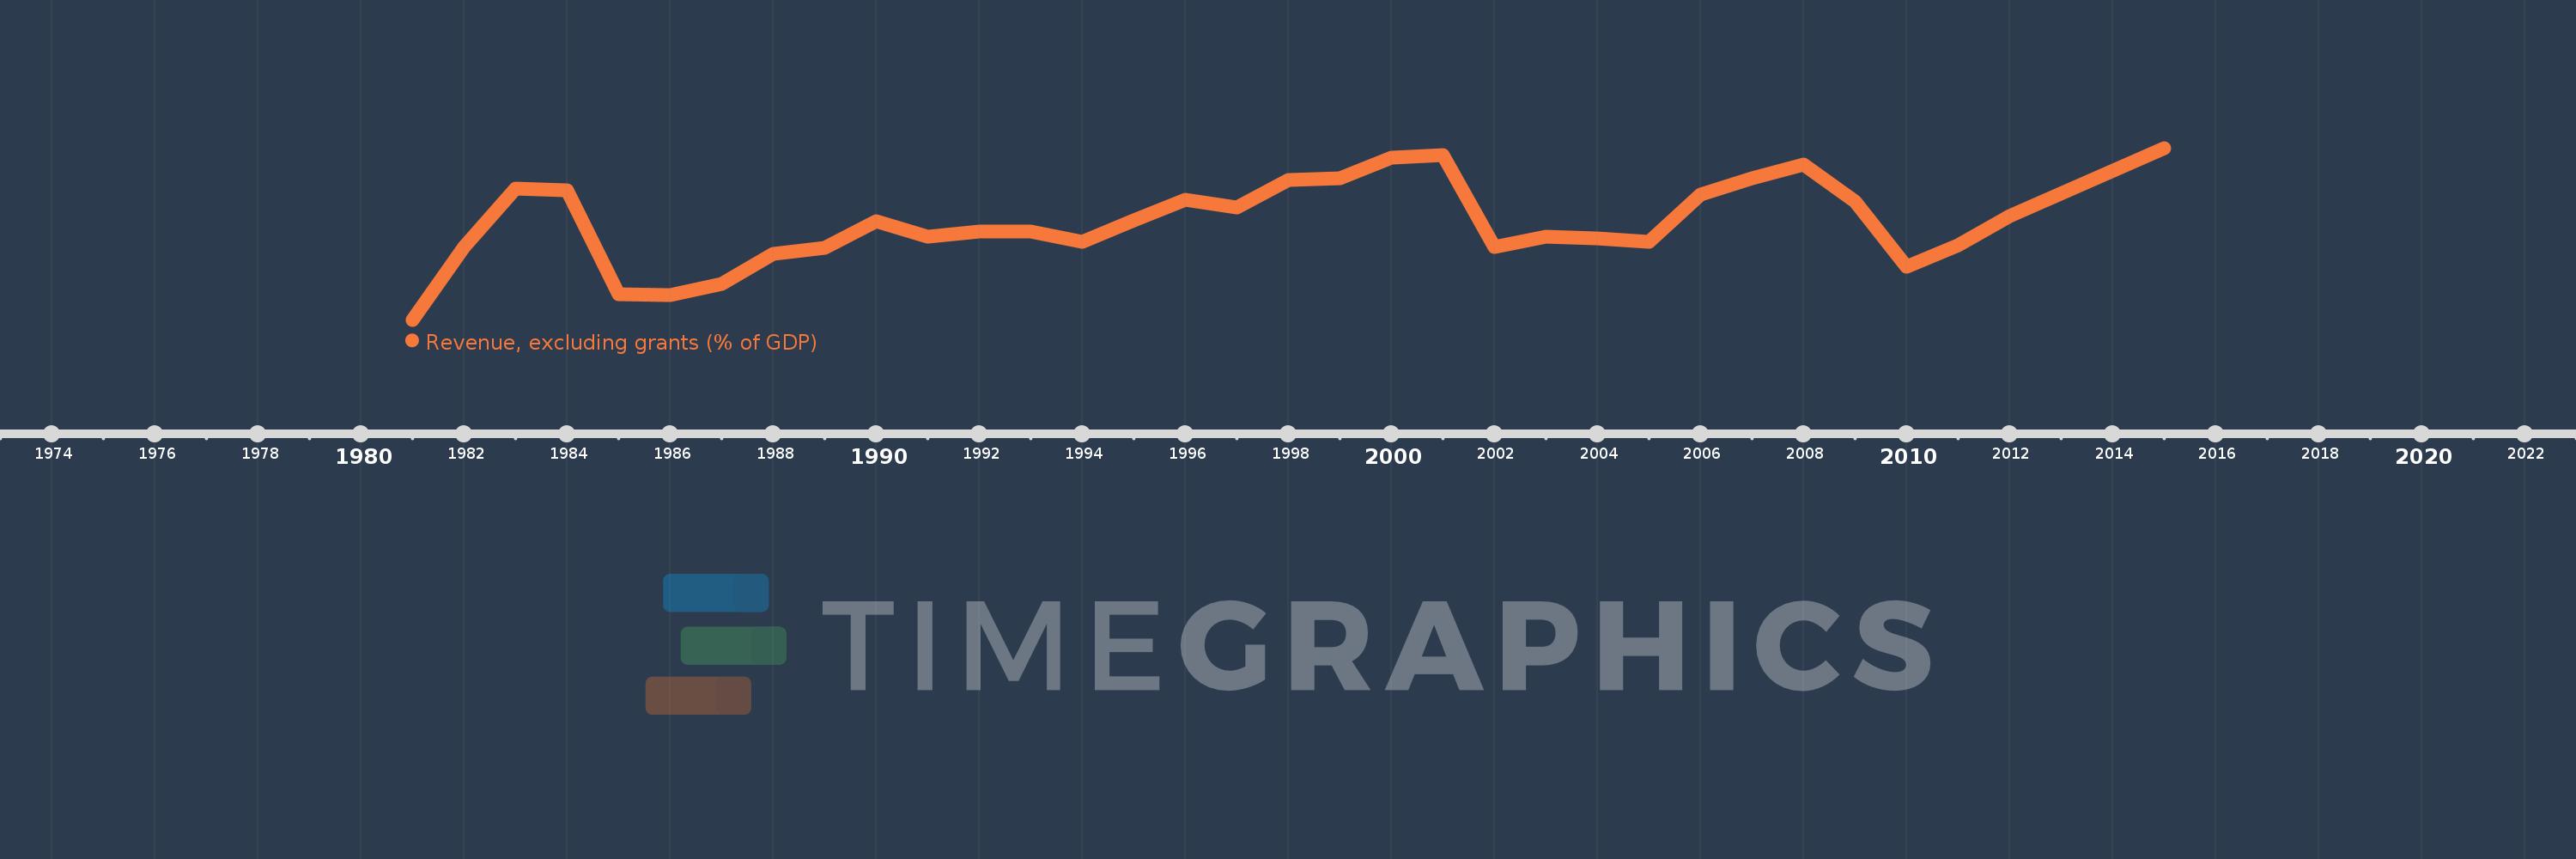
Revenue, excluding grants (% of GDP)
2015,2012,2011,2010,2009,2008,2007,2006,2005,2004,2003,2002,2001,2000,1999,1998,1997,1996,1995,1994,1993,1992,1991,1990,1989,1988,1987,1986,1985,1984,1983,1982,1981
This statistics in other country:
AfghanistanAlbaniaAlgeriaAngolaAntigua and BarbudaArgentinaArmeniaAustraliaAustriaAzerbaijanBahamas, TheBahrainBangladeshBarbadosBelarusBelgiumBelizeBeninBhutanBoliviaBosnia and HerzegovinaBotswanaBrazilBulgariaBurkina FasoBurundiCabo VerdeCambodiaCanadaCaribbean small statesCentral African RepublicCentral Europe and the BalticsChileChinaColombiaCongo, Dem. Rep.Congo, Rep.Costa RicaCote d'IvoireCroatiaCyprusCzech RepublicDenmarkDominicaDominican RepublicEarly-demographic dividendEast Asia & PacificEast Asia & Pacific (excluding high income)East Asia & Pacific (IDA & IBRD countries)Egypt, Arab Rep.El SalvadorEquatorial GuineaEstoniaEthiopiaEuro areaEurope & Central AsiaEurope & Central Asia (excluding high income)Europe & Central Asia (IDA & IBRD countries)European UnionFijiFinlandFranceGambia, TheGeorgiaGermanyGhanaGreeceGrenadaGuatemalaHeavily indebted poor countries (HIPC)High incomeHondurasHong Kong SAR, ChinaHungaryIBRD onlyIcelandIDA & IBRD totalIDA blendIDA onlyIDA totalIndiaIndonesiaIran, Islamic Rep.IraqIrelandIsraelItalyJamaicaJapanJordanKazakhstanKenyaKiribatiKorea, Rep.KuwaitKyrgyz RepublicLao PDRLate-demographic dividendLatin America & Caribbean Latin America & Caribbean (excluding high income)Latin America & the Caribbean (IDA & IBRD countries)LatviaLeast developed countries: UN classificationLebanonLesothoLiberiaLithuaniaLow & middle incomeLow incomeLower middle incomeLuxembourgMacao SAR, ChinaMacedonia, FYRMadagascarMalawiMalaysiaMaldivesMaliMaltaMauritiusMexicoMicronesia, Fed. Sts.Middle East & North Africa (excluding high income)Middle East & North Africa (IDA & IBRD countries)Middle incomeMoldovaMongoliaMoroccoMozambiqueMyanmarNamibiaNepalNetherlandsNew ZealandNicaraguaNigeriaNorth AmericaNorwayOECD membersOmanOther small statesPacific island small statesPakistanPanamaPapua New GuineaParaguayPeruPhilippinesPolandPortugalPost-demographic dividendPre-demographic dividendQatarRomaniaRussian FederationRwandaSamoaSan MarinoSao Tome and PrincipeSenegalSerbiaSeychellesSierra LeoneSingaporeSlovak RepublicSloveniaSmall statesSolomon IslandsSouth AfricaSouth AsiaSouth Asia (IDA & IBRD)SpainSri LankaSt. Kitts and NevisSt. LuciaSt. Vincent and the GrenadinesSub-Saharan Africa Sub-Saharan Africa (excluding high income)Sub-Saharan Africa (IDA & IBRD countries)SurinameSwazilandSwedenSwitzerlandSyrian Arab RepublicTajikistanTanzaniaThailandTimor-LesteTogoTrinidad and TobagoTunisiaTurkeyUgandaUkraineUnited Arab EmiratesUnited KingdomUnited StatesUpper middle incomeUruguayVanuatuVenezuela, RBVietnamWest Bank and GazaWorldYemen, Rep.ZambiaZimbabwe Timeline:
This timeline shows a graph from 1981 to 2015 of Maldives. No data until 1980. Number of actual observations by date: 33.
Source name:
World Development Indicators
Source organization:
International Monetary Fund, Government Finance Statistics Yearbook and data files, and World Bank and OECD GDP estimates.
Categories, topics:
Economy & Growth, Public Sector
Last updated:
apr 23, 2017
Indicators value changes by year
Minimum:
14.192
jan 1, 1981
Maximum:
30.651
jan 1, 2015
At the date of observation
Value
Absolute change
Change from previous value
jan 1, 1981
14.192
+14.192
0.0%
jan 1, 1982
21.148
+6.955
49.01%
jan 1, 1983
26.768
+5.62
26.57%
jan 1, 1984
26.613
-0.155
-0.58%
jan 1, 1985
16.619
-9.994
-37.55%
jan 1, 1986
16.515
-0.104
-0.63%
jan 1, 1987
17.652
+1.137
6.88%
jan 1, 1988
20.491
+2.839
16.08%
jan 1, 1989
21.116
+0.625
3.05%
jan 1, 1990
23.614
+2.498
11.83%
jan 1, 1991
22.141
-1.473
-6.24%
jan 1, 1992
22.655
+0.514
2.32%
jan 1, 1993
22.681
+0.025
0.11%
jan 1, 1994
21.632
-1.049
-4.62%
jan 1, 1995
23.752
+2.12
9.8%
jan 1, 1996
25.677
+1.925
8.1%
jan 1, 1997
24.931
-0.745
-2.9%
jan 1, 1998
27.617
+2.686
10.77%
jan 1, 1999
27.743
+0.126
0.46%
jan 1, 2000
29.683
+1.94
6.99%
jan 1, 2001
29.974
+0.291
0.98%
jan 1, 2002
21.197
-8.776
-29.28%
jan 1, 2003
22.111
+0.913
4.31%
jan 1, 2004
21.989
-0.121
-0.55%
jan 1, 2005
21.646
-0.343
-1.56%
jan 1, 2006
26.185
+4.539
20.97%
jan 1, 2007
27.746
+1.56
5.96%
jan 1, 2008
29.043
+1.297
4.68%
jan 1, 2009
25.538
-3.505
-12.07%
jan 1, 2010
19.263
-6.275
-24.57%
jan 1, 2011
21.329
+2.066
10.72%
jan 1, 2012
24.149
+2.82
13.22%
jan 1, 2015
30.651
+6.503
26.93%
Ranking of countries by current statistics by years


Comments: