29
/
en
AIzaSyAYiBZKx7MnpbEhh9jyipgxe19OcubqV5w
April 1, 2024
249412
Sri Lanka
LKA
true
2
1
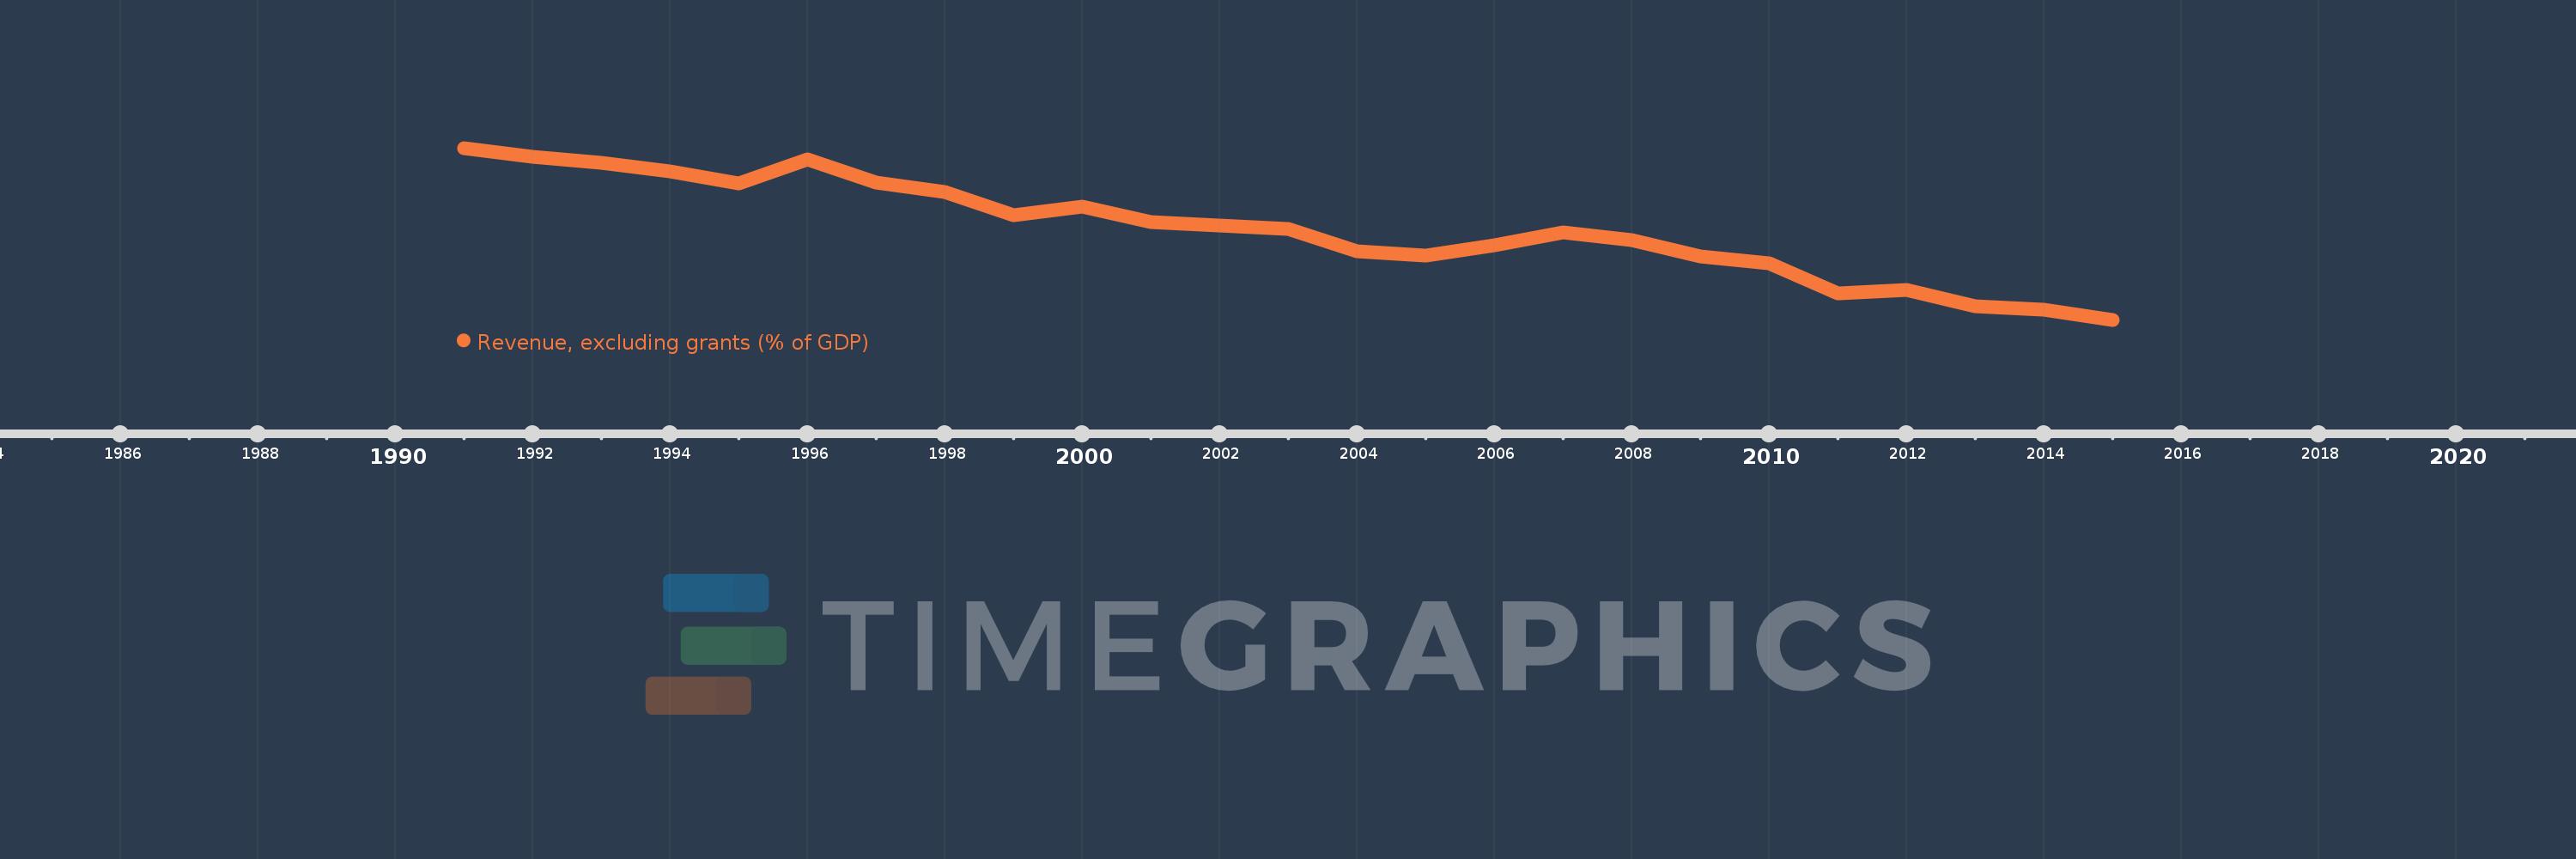
Revenue, excluding grants (% of GDP)
2015,2014,2013,2012,2011,2010,2009,2008,2007,2006,2005,2004,2003,2002,2001,2000,1999,1998,1997,1996,1995,1994,1993,1992,1991
This statistics in other country:
AfghanistanAlbaniaAlgeriaAngolaAntigua and BarbudaArgentinaArmeniaAustraliaAustriaAzerbaijanBahamas, TheBahrainBangladeshBarbadosBelarusBelgiumBelizeBeninBhutanBoliviaBosnia and HerzegovinaBotswanaBrazilBulgariaBurkina FasoBurundiCabo VerdeCambodiaCanadaCaribbean small statesCentral African RepublicCentral Europe and the BalticsChileChinaColombiaCongo, Dem. Rep.Congo, Rep.Costa RicaCote d'IvoireCroatiaCyprusCzech RepublicDenmarkDominicaDominican RepublicEarly-demographic dividendEast Asia & PacificEast Asia & Pacific (excluding high income)East Asia & Pacific (IDA & IBRD countries)Egypt, Arab Rep.El SalvadorEquatorial GuineaEstoniaEthiopiaEuro areaEurope & Central AsiaEurope & Central Asia (excluding high income)Europe & Central Asia (IDA & IBRD countries)European UnionFijiFinlandFranceGambia, TheGeorgiaGermanyGhanaGreeceGrenadaGuatemalaHeavily indebted poor countries (HIPC)High incomeHondurasHong Kong SAR, ChinaHungaryIBRD onlyIcelandIDA & IBRD totalIDA blendIDA onlyIDA totalIndiaIndonesiaIran, Islamic Rep.IraqIrelandIsraelItalyJamaicaJapanJordanKazakhstanKenyaKiribatiKorea, Rep.KuwaitKyrgyz RepublicLao PDRLate-demographic dividendLatin America & Caribbean Latin America & Caribbean (excluding high income)Latin America & the Caribbean (IDA & IBRD countries)LatviaLeast developed countries: UN classificationLebanonLesothoLiberiaLithuaniaLow & middle incomeLow incomeLower middle incomeLuxembourgMacao SAR, ChinaMacedonia, FYRMadagascarMalawiMalaysiaMaldivesMaliMaltaMauritiusMexicoMicronesia, Fed. Sts.Middle East & North Africa (excluding high income)Middle East & North Africa (IDA & IBRD countries)Middle incomeMoldovaMongoliaMoroccoMozambiqueMyanmarNamibiaNepalNetherlandsNew ZealandNicaraguaNigeriaNorth AmericaNorwayOECD membersOmanOther small statesPacific island small statesPakistanPanamaPapua New GuineaParaguayPeruPhilippinesPolandPortugalPost-demographic dividendPre-demographic dividendQatarRomaniaRussian FederationRwandaSamoaSan MarinoSao Tome and PrincipeSenegalSerbiaSeychellesSierra LeoneSingaporeSlovak RepublicSloveniaSmall statesSolomon IslandsSouth AfricaSouth AsiaSouth Asia (IDA & IBRD)SpainSri LankaSt. Kitts and NevisSt. LuciaSt. Vincent and the GrenadinesSub-Saharan Africa Sub-Saharan Africa (excluding high income)Sub-Saharan Africa (IDA & IBRD countries)SurinameSwazilandSwedenSwitzerlandSyrian Arab RepublicTajikistanTanzaniaThailandTimor-LesteTogoTrinidad and TobagoTunisiaTurkeyUgandaUkraineUnited Arab EmiratesUnited KingdomUnited StatesUpper middle incomeUruguayVanuatuVenezuela, RBVietnamWest Bank and GazaWorldYemen, Rep.ZambiaZimbabwe Timeline:
This timeline shows a graph from 1991 to 2015 of Sri Lanka. No data until 1990. Number of actual observations by date: 25.
Source name:
World Development Indicators
Source organization:
International Monetary Fund, Government Finance Statistics Yearbook and data files, and World Bank and OECD GDP estimates.
Categories, topics:
Economy & Growth, Public Sector
Last updated:
apr 23, 2017
Indicators value changes by year
Minimum:
11.271
jan 1, 2015
Maximum:
21.019
jan 1, 1991
At the date of observation
Value
Absolute change
Change from previous value
jan 1, 1991
21.019
+21.019
0.0%
jan 1, 1992
20.526
-0.493
-2.35%
jan 1, 1993
20.168
-0.358
-1.74%
jan 1, 1994
19.702
-0.466
-2.31%
jan 1, 1995
19.002
-0.7
-3.55%
jan 1, 1996
20.39
+1.388
7.31%
jan 1, 1997
19.039
-1.351
-6.63%
jan 1, 1998
18.509
-0.53
-2.79%
jan 1, 1999
17.187
-1.321
-7.14%
jan 1, 2000
17.713
+0.525
3.06%
jan 1, 2001
16.797
-0.916
-5.17%
jan 1, 2002
16.64
-0.157
-0.94%
jan 1, 2003
16.431
-0.209
-1.26%
jan 1, 2004
15.159
-1.272
-7.74%
jan 1, 2005
14.892
-0.267
-1.76%
jan 1, 2006
15.479
+0.587
3.94%
jan 1, 2007
16.226
+0.747
4.82%
jan 1, 2008
15.774
-0.452
-2.78%
jan 1, 2009
14.856
-0.918
-5.82%
jan 1, 2010
14.47
-0.387
-2.6%
jan 1, 2011
12.743
-1.727
-11.93%
jan 1, 2012
12.949
+0.206
1.62%
jan 1, 2013
12.031
-0.917
-7.08%
jan 1, 2014
11.858
-0.173
-1.44%
jan 1, 2015
11.271
-0.588
-4.96%
Ranking of countries by current statistics by years


Comments: