29
/
en
AIzaSyAYiBZKx7MnpbEhh9jyipgxe19OcubqV5w
April 1, 2024
63004
World
WLD
false
2
1
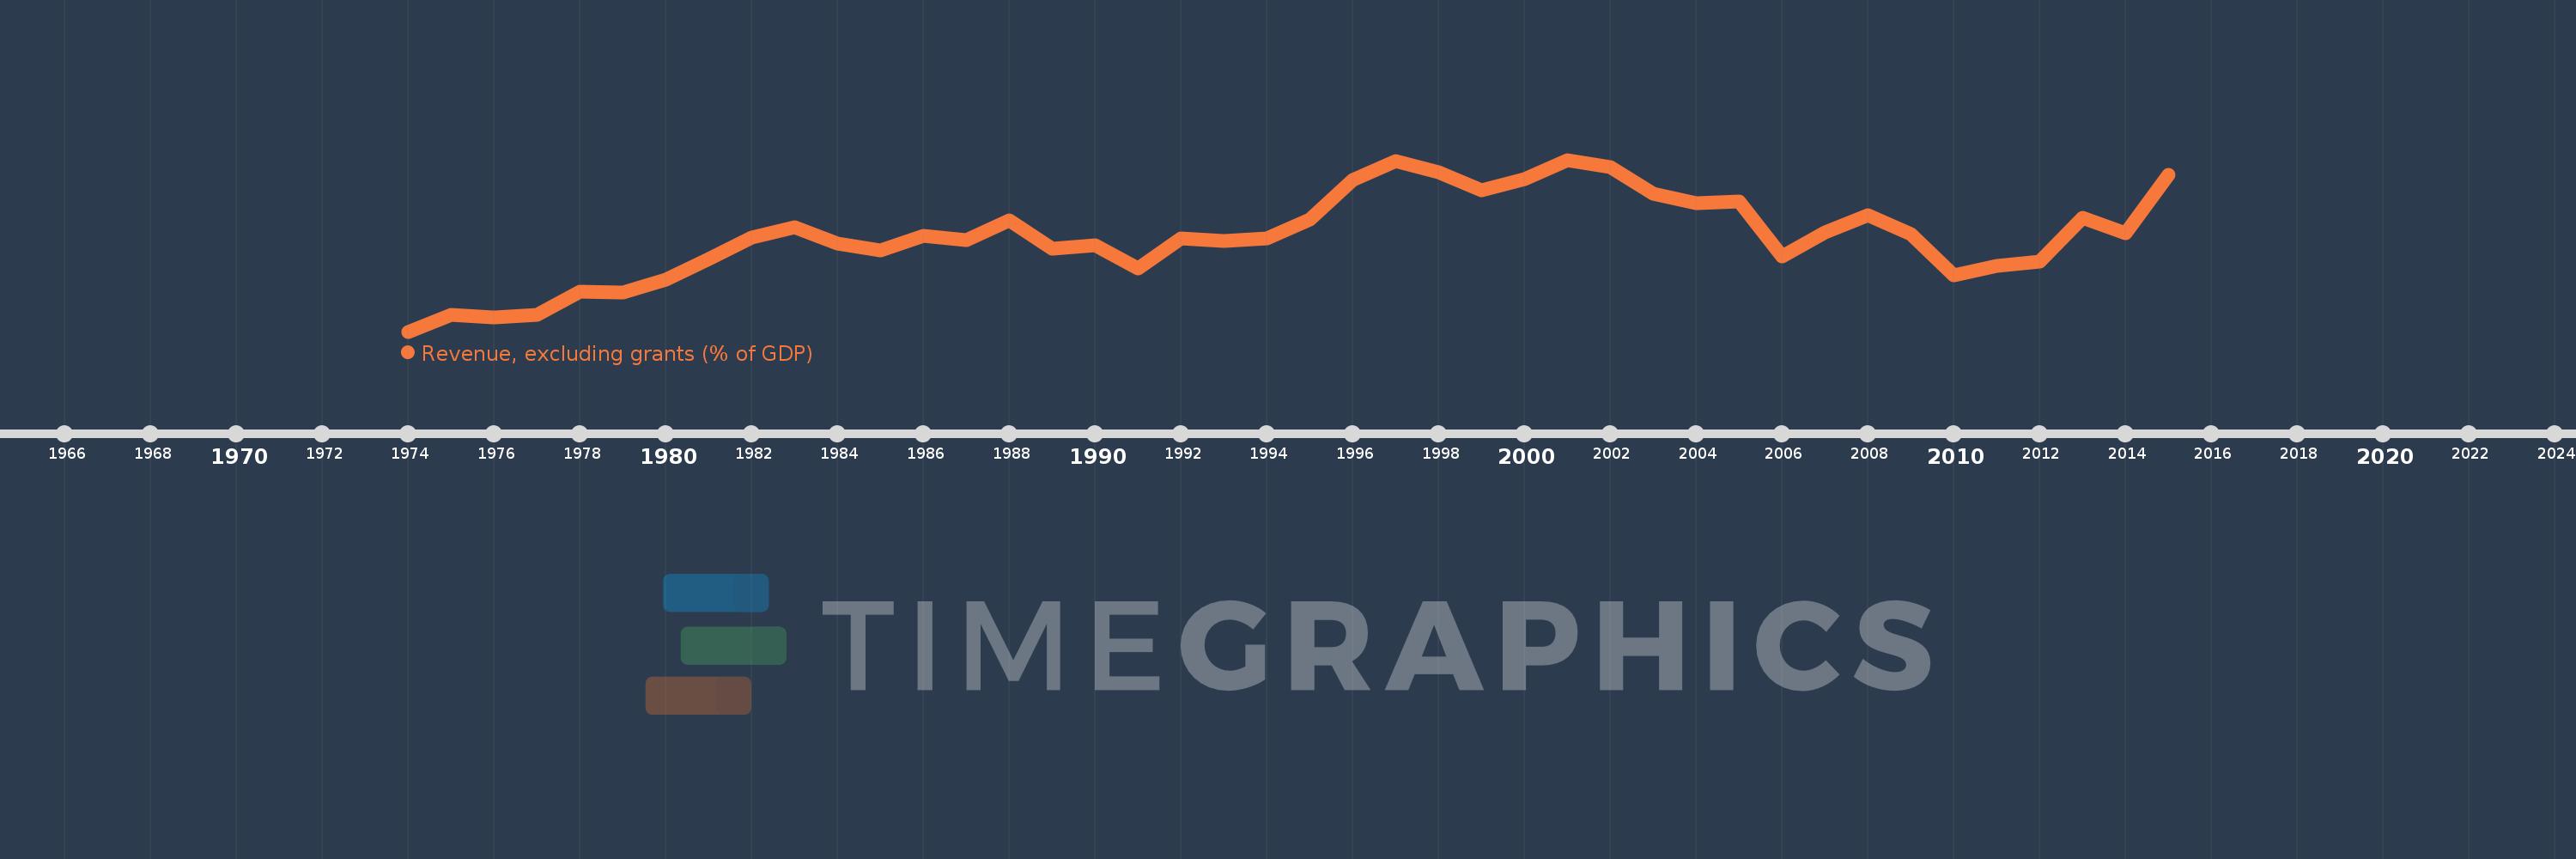
Revenue, excluding grants (% of GDP)
2015,2014,2013,2012,2011,2010,2009,2008,2007,2006,2005,2004,2003,2002,2001,2000,1999,1998,1997,1996,1995,1994,1993,1992,1991,1990,1989,1988,1987,1986,1985,1984,1983,1982,1981,1980,1979,1978,1977,1976,1975,1974
This statistics in other country:
AfghanistanAlbaniaAlgeriaAngolaAntigua and BarbudaArgentinaArmeniaAustraliaAustriaAzerbaijanBahamas, TheBahrainBangladeshBarbadosBelarusBelgiumBelizeBeninBhutanBoliviaBosnia and HerzegovinaBotswanaBrazilBulgariaBurkina FasoBurundiCabo VerdeCambodiaCanadaCaribbean small statesCentral African RepublicCentral Europe and the BalticsChileChinaColombiaCongo, Dem. Rep.Congo, Rep.Costa RicaCote d'IvoireCroatiaCyprusCzech RepublicDenmarkDominicaDominican RepublicEarly-demographic dividendEast Asia & PacificEast Asia & Pacific (excluding high income)East Asia & Pacific (IDA & IBRD countries)Egypt, Arab Rep.El SalvadorEquatorial GuineaEstoniaEthiopiaEuro areaEurope & Central AsiaEurope & Central Asia (excluding high income)Europe & Central Asia (IDA & IBRD countries)European UnionFijiFinlandFranceGambia, TheGeorgiaGermanyGhanaGreeceGrenadaGuatemalaHeavily indebted poor countries (HIPC)High incomeHondurasHong Kong SAR, ChinaHungaryIBRD onlyIcelandIDA & IBRD totalIDA blendIDA onlyIDA totalIndiaIndonesiaIran, Islamic Rep.IraqIrelandIsraelItalyJamaicaJapanJordanKazakhstanKenyaKiribatiKorea, Rep.KuwaitKyrgyz RepublicLao PDRLate-demographic dividendLatin America & Caribbean Latin America & Caribbean (excluding high income)Latin America & the Caribbean (IDA & IBRD countries)LatviaLeast developed countries: UN classificationLebanonLesothoLiberiaLithuaniaLow & middle incomeLow incomeLower middle incomeLuxembourgMacao SAR, ChinaMacedonia, FYRMadagascarMalawiMalaysiaMaldivesMaliMaltaMauritiusMexicoMicronesia, Fed. Sts.Middle East & North Africa (excluding high income)Middle East & North Africa (IDA & IBRD countries)Middle incomeMoldovaMongoliaMoroccoMozambiqueMyanmarNamibiaNepalNetherlandsNew ZealandNicaraguaNigeriaNorth AmericaNorwayOECD membersOmanOther small statesPacific island small statesPakistanPanamaPapua New GuineaParaguayPeruPhilippinesPolandPortugalPost-demographic dividendPre-demographic dividendQatarRomaniaRussian FederationRwandaSamoaSan MarinoSao Tome and PrincipeSenegalSerbiaSeychellesSierra LeoneSingaporeSlovak RepublicSloveniaSmall statesSolomon IslandsSouth AfricaSouth AsiaSouth Asia (IDA & IBRD)SpainSri LankaSt. Kitts and NevisSt. LuciaSt. Vincent and the GrenadinesSub-Saharan Africa Sub-Saharan Africa (excluding high income)Sub-Saharan Africa (IDA & IBRD countries)SurinameSwazilandSwedenSwitzerlandSyrian Arab RepublicTajikistanTanzaniaThailandTimor-LesteTogoTrinidad and TobagoTunisiaTurkeyUgandaUkraineUnited Arab EmiratesUnited KingdomUnited StatesUpper middle incomeUruguayVanuatuVenezuela, RBVietnamWest Bank and GazaWorldYemen, Rep.ZambiaZimbabwe Timeline:
This timeline shows a graph from 1974 to 2015 of World. No data until 1973. Number of actual observations by date: 42.
Source name:
World Development Indicators
Source organization:
International Monetary Fund, Government Finance Statistics Yearbook and data files, and World Bank and OECD GDP estimates.
Categories, topics:
Economy & Growth, Public Sector
Last updated:
apr 23, 2017
Indicators value changes by year
Maximum:
25.719
jan 1, 2001
At the date of observation
Value
Absolute change
Change from previous value
jan 1, 1974
20.07
+20.07
0.0%
jan 1, 1975
20.629
+0.56
2.79%
jan 1, 1976
20.542
-0.087
-0.42%
jan 1, 1977
20.617
+0.075
0.37%
jan 1, 1978
21.372
+0.754
3.66%
jan 1, 1979
21.35
-0.021
-0.1%
jan 1, 1980
21.781
+0.431
2.02%
jan 1, 1981
22.462
+0.681
3.13%
jan 1, 1982
23.171
+0.709
3.15%
jan 1, 1983
23.514
+0.343
1.48%
jan 1, 1984
22.97
-0.543
-2.31%
jan 1, 1985
22.737
-0.233
-1.02%
jan 1, 1986
23.227
+0.49
2.15%
jan 1, 1987
23.076
-0.151
-0.65%
jan 1, 1988
23.717
+0.641
2.78%
jan 1, 1989
22.792
-0.926
-3.9%
jan 1, 1990
22.907
+0.115
0.51%
jan 1, 1991
22.151
-0.756
-3.3%
jan 1, 1992
23.131
+0.98
4.42%
jan 1, 1993
23.043
-0.088
-0.38%
jan 1, 1994
23.138
+0.095
0.41%
jan 1, 1995
23.761
+0.623
2.69%
jan 1, 1996
25.067
+1.306
5.5%
jan 1, 1997
25.674
+0.607
2.42%
jan 1, 1998
25.298
-0.376
-1.46%
jan 1, 1999
24.707
-0.591
-2.34%
jan 1, 2000
25.081
+0.374
1.51%
jan 1, 2001
25.719
+0.638
2.54%
jan 1, 2002
25.469
-0.25
-0.97%
jan 1, 2003
24.616
-0.853
-3.35%
jan 1, 2004
24.298
-0.318
-1.29%
jan 1, 2005
24.344
+0.047
0.19%
jan 1, 2006
22.551
-1.793
-7.37%
jan 1, 2007
23.337
+0.786
3.48%
jan 1, 2008
23.901
+0.564
2.42%
jan 1, 2009
23.28
-0.622
-2.6%
jan 1, 2010
21.931
-1.349
-5.79%
jan 1, 2011
22.242
+0.311
1.42%
jan 1, 2012
22.373
+0.131
0.59%
jan 1, 2013
23.803
+1.43
6.39%
jan 1, 2014
23.312
-0.491
-2.06%
jan 1, 2015
25.232
+1.92
8.23%
Ranking of countries by current statistics by years


Comments: