29
/
en
AIzaSyAYiBZKx7MnpbEhh9jyipgxe19OcubqV5w
April 1, 2024
74351
Austria
AUT
true
2
1
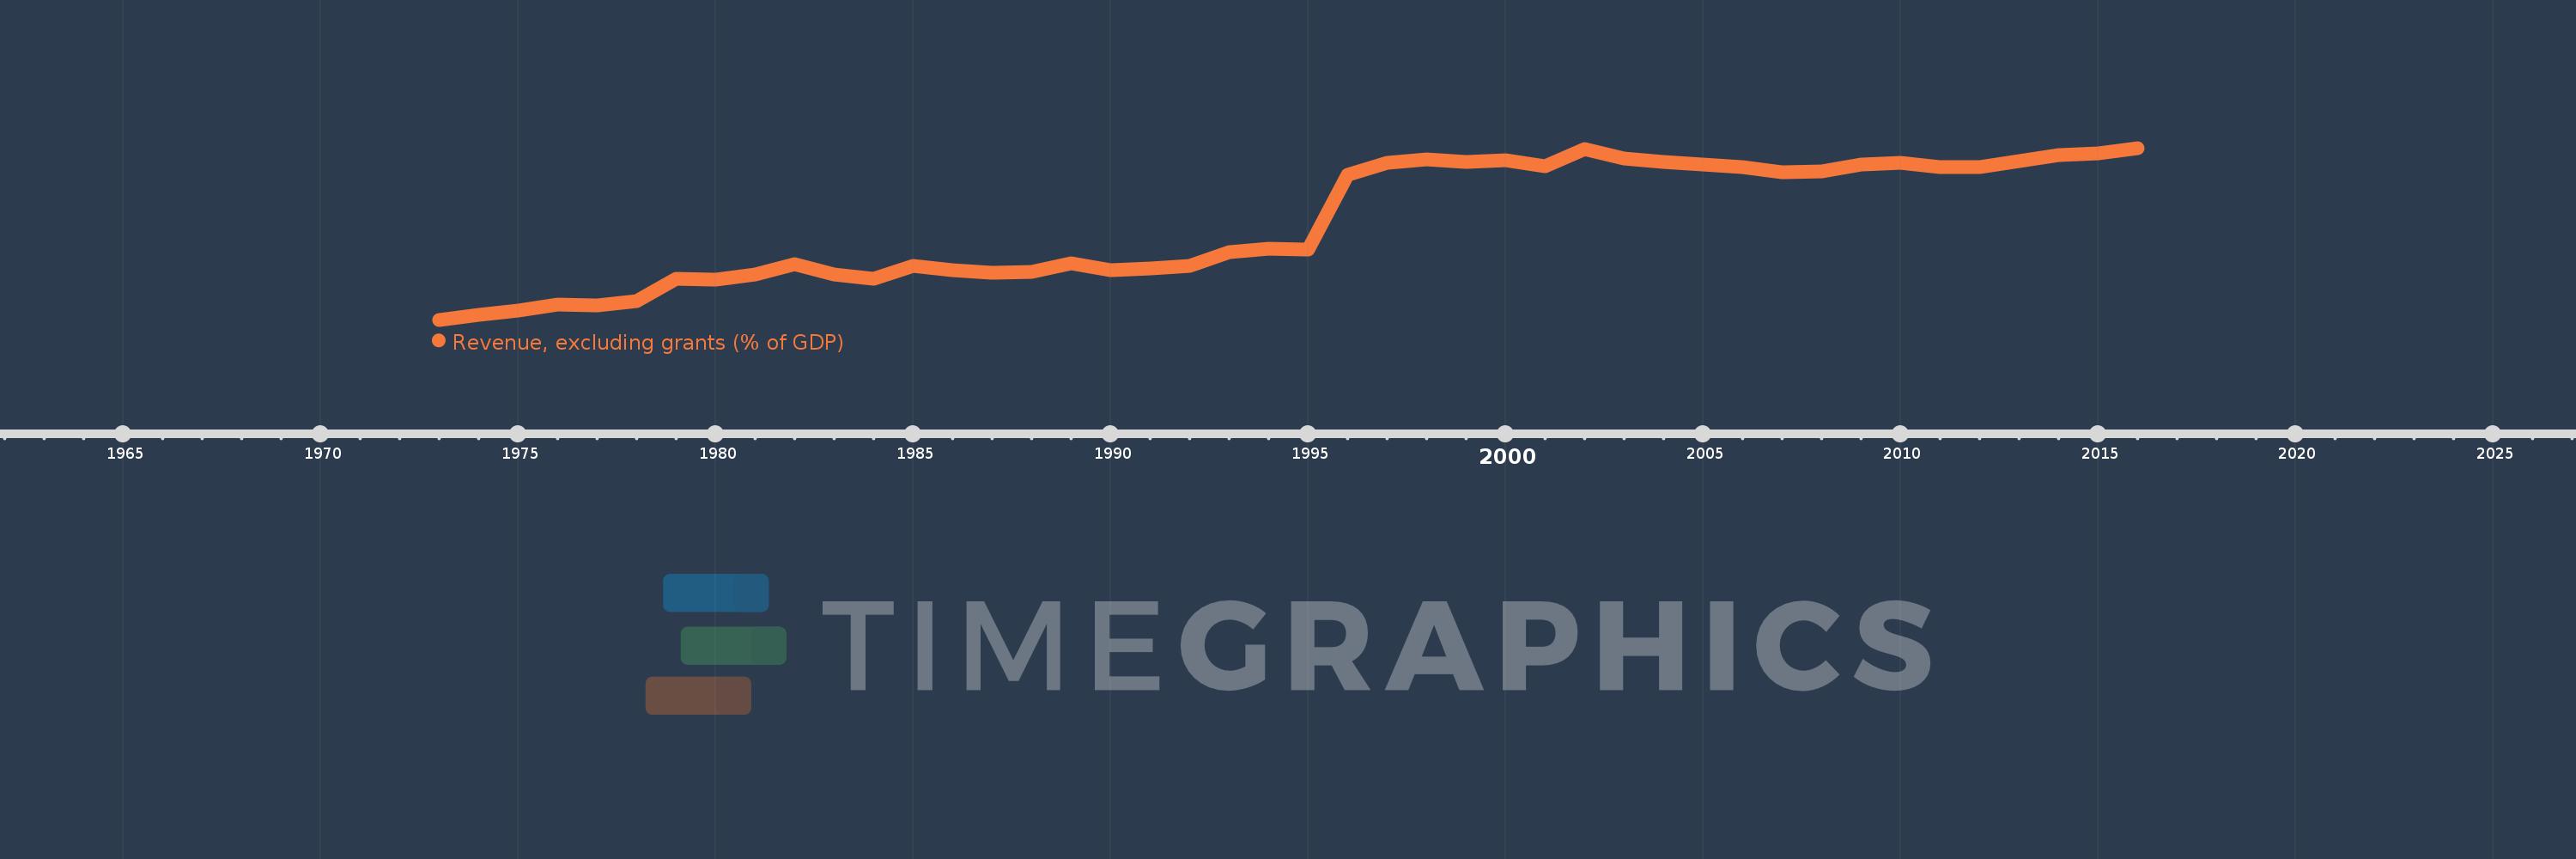
Revenue, excluding grants (% of GDP)
2016,2015,2014,2013,2012,2011,2010,2009,2008,2007,2006,2005,2004,2003,2002,2001,2000,1999,1998,1997,1996,1995,1994,1993,1992,1991,1990,1989,1988,1987,1986,1985,1984,1983,1982,1981,1980,1979,1978,1977,1976,1975,1974,1973
This statistics in other country:
AfghanistanAlbaniaAlgeriaAngolaAntigua and BarbudaArgentinaArmeniaAustraliaAustriaAzerbaijanBahamas, TheBahrainBangladeshBarbadosBelarusBelgiumBelizeBeninBhutanBoliviaBosnia and HerzegovinaBotswanaBrazilBulgariaBurkina FasoBurundiCabo VerdeCambodiaCanadaCaribbean small statesCentral African RepublicCentral Europe and the BalticsChileChinaColombiaCongo, Dem. Rep.Congo, Rep.Costa RicaCote d'IvoireCroatiaCyprusCzech RepublicDenmarkDominicaDominican RepublicEarly-demographic dividendEast Asia & PacificEast Asia & Pacific (excluding high income)East Asia & Pacific (IDA & IBRD countries)Egypt, Arab Rep.El SalvadorEquatorial GuineaEstoniaEthiopiaEuro areaEurope & Central AsiaEurope & Central Asia (excluding high income)Europe & Central Asia (IDA & IBRD countries)European UnionFijiFinlandFranceGambia, TheGeorgiaGermanyGhanaGreeceGrenadaGuatemalaHeavily indebted poor countries (HIPC)High incomeHondurasHong Kong SAR, ChinaHungaryIBRD onlyIcelandIDA & IBRD totalIDA blendIDA onlyIDA totalIndiaIndonesiaIran, Islamic Rep.IraqIrelandIsraelItalyJamaicaJapanJordanKazakhstanKenyaKiribatiKorea, Rep.KuwaitKyrgyz RepublicLao PDRLate-demographic dividendLatin America & Caribbean Latin America & Caribbean (excluding high income)Latin America & the Caribbean (IDA & IBRD countries)LatviaLeast developed countries: UN classificationLebanonLesothoLiberiaLithuaniaLow & middle incomeLow incomeLower middle incomeLuxembourgMacao SAR, ChinaMacedonia, FYRMadagascarMalawiMalaysiaMaldivesMaliMaltaMauritiusMexicoMicronesia, Fed. Sts.Middle East & North Africa (excluding high income)Middle East & North Africa (IDA & IBRD countries)Middle incomeMoldovaMongoliaMoroccoMozambiqueMyanmarNamibiaNepalNetherlandsNew ZealandNicaraguaNigeriaNorth AmericaNorwayOECD membersOmanOther small statesPacific island small statesPakistanPanamaPapua New GuineaParaguayPeruPhilippinesPolandPortugalPost-demographic dividendPre-demographic dividendQatarRomaniaRussian FederationRwandaSamoaSan MarinoSao Tome and PrincipeSenegalSerbiaSeychellesSierra LeoneSingaporeSlovak RepublicSloveniaSmall statesSolomon IslandsSouth AfricaSouth AsiaSouth Asia (IDA & IBRD)SpainSri LankaSt. Kitts and NevisSt. LuciaSt. Vincent and the GrenadinesSub-Saharan Africa Sub-Saharan Africa (excluding high income)Sub-Saharan Africa (IDA & IBRD countries)SurinameSwazilandSwedenSwitzerlandSyrian Arab RepublicTajikistanTanzaniaThailandTimor-LesteTogoTrinidad and TobagoTunisiaTurkeyUgandaUkraineUnited Arab EmiratesUnited KingdomUnited StatesUpper middle incomeUruguayVanuatuVenezuela, RBVietnamWest Bank and GazaWorldYemen, Rep.ZambiaZimbabwe Timeline:
This timeline shows a graph from 1973 to 2016 of Austria. No data until 1972. Number of actual observations by date: 44.
Source name:
World Development Indicators
Source organization:
International Monetary Fund, Government Finance Statistics Yearbook and data files, and World Bank and OECD GDP estimates.
Categories, topics:
Economy & Growth, Public Sector
Last updated:
apr 23, 2017
Indicators value changes by year
Minimum:
27.808
jan 1, 1973
Maximum:
45.711
jan 1, 2016
At the date of observation
Value
Absolute change
Change from previous value
jan 1, 1973
27.808
+27.808
0.0%
jan 1, 1974
28.312
+0.504
1.81%
jan 1, 1975
28.777
+0.466
1.64%
jan 1, 1976
29.379
+0.602
2.09%
jan 1, 1977
29.343
-0.036
-0.12%
jan 1, 1978
29.756
+0.414
1.41%
jan 1, 1979
32.057
+2.3
7.73%
jan 1, 1980
31.991
-0.066
-0.2%
jan 1, 1981
32.482
+0.491
1.53%
jan 1, 1982
33.585
+1.103
3.39%
jan 1, 1983
32.527
-1.058
-3.15%
jan 1, 1984
32.064
-0.463
-1.42%
jan 1, 1985
33.438
+1.375
4.29%
jan 1, 1986
32.994
-0.444
-1.33%
jan 1, 1987
32.731
-0.263
-0.8%
jan 1, 1988
32.765
+0.034
0.1%
jan 1, 1989
33.688
+0.923
2.82%
jan 1, 1990
32.988
-0.7
-2.08%
jan 1, 1991
33.109
+0.121
0.37%
jan 1, 1992
33.398
+0.29
0.88%
jan 1, 1993
34.881
+1.483
4.44%
jan 1, 1994
35.168
+0.287
0.82%
jan 1, 1995
35.115
-0.053
-0.15%
jan 1, 1996
42.927
+7.812
22.25%
jan 1, 1997
44.205
+1.278
2.98%
jan 1, 1998
44.477
+0.272
0.62%
jan 1, 1999
44.226
-0.252
-0.57%
jan 1, 2000
44.474
+0.248
0.56%
jan 1, 2001
43.824
-0.65
-1.46%
jan 1, 2002
45.629
+1.805
4.12%
jan 1, 2003
44.576
-1.053
-2.31%
jan 1, 2004
44.216
-0.36
-0.81%
jan 1, 2005
43.971
-0.245
-0.55%
jan 1, 2006
43.691
-0.28
-0.64%
jan 1, 2007
43.171
-0.52
-1.19%
jan 1, 2008
43.225
+0.054
0.13%
jan 1, 2009
43.992
+0.767
1.77%
jan 1, 2010
44.148
+0.156
0.35%
jan 1, 2011
43.682
-0.466
-1.06%
jan 1, 2012
43.753
+0.07
0.16%
jan 1, 2013
44.352
+0.599
1.37%
jan 1, 2014
45.01
+0.659
1.48%
jan 1, 2015
45.118
+0.108
0.24%
jan 1, 2016
45.711
+0.593
1.31%
Ranking of countries by current statistics by years


Comments: