29
/
en
AIzaSyAYiBZKx7MnpbEhh9jyipgxe19OcubqV5w
April 1, 2024
191865
Malta
MLT
true
2
1
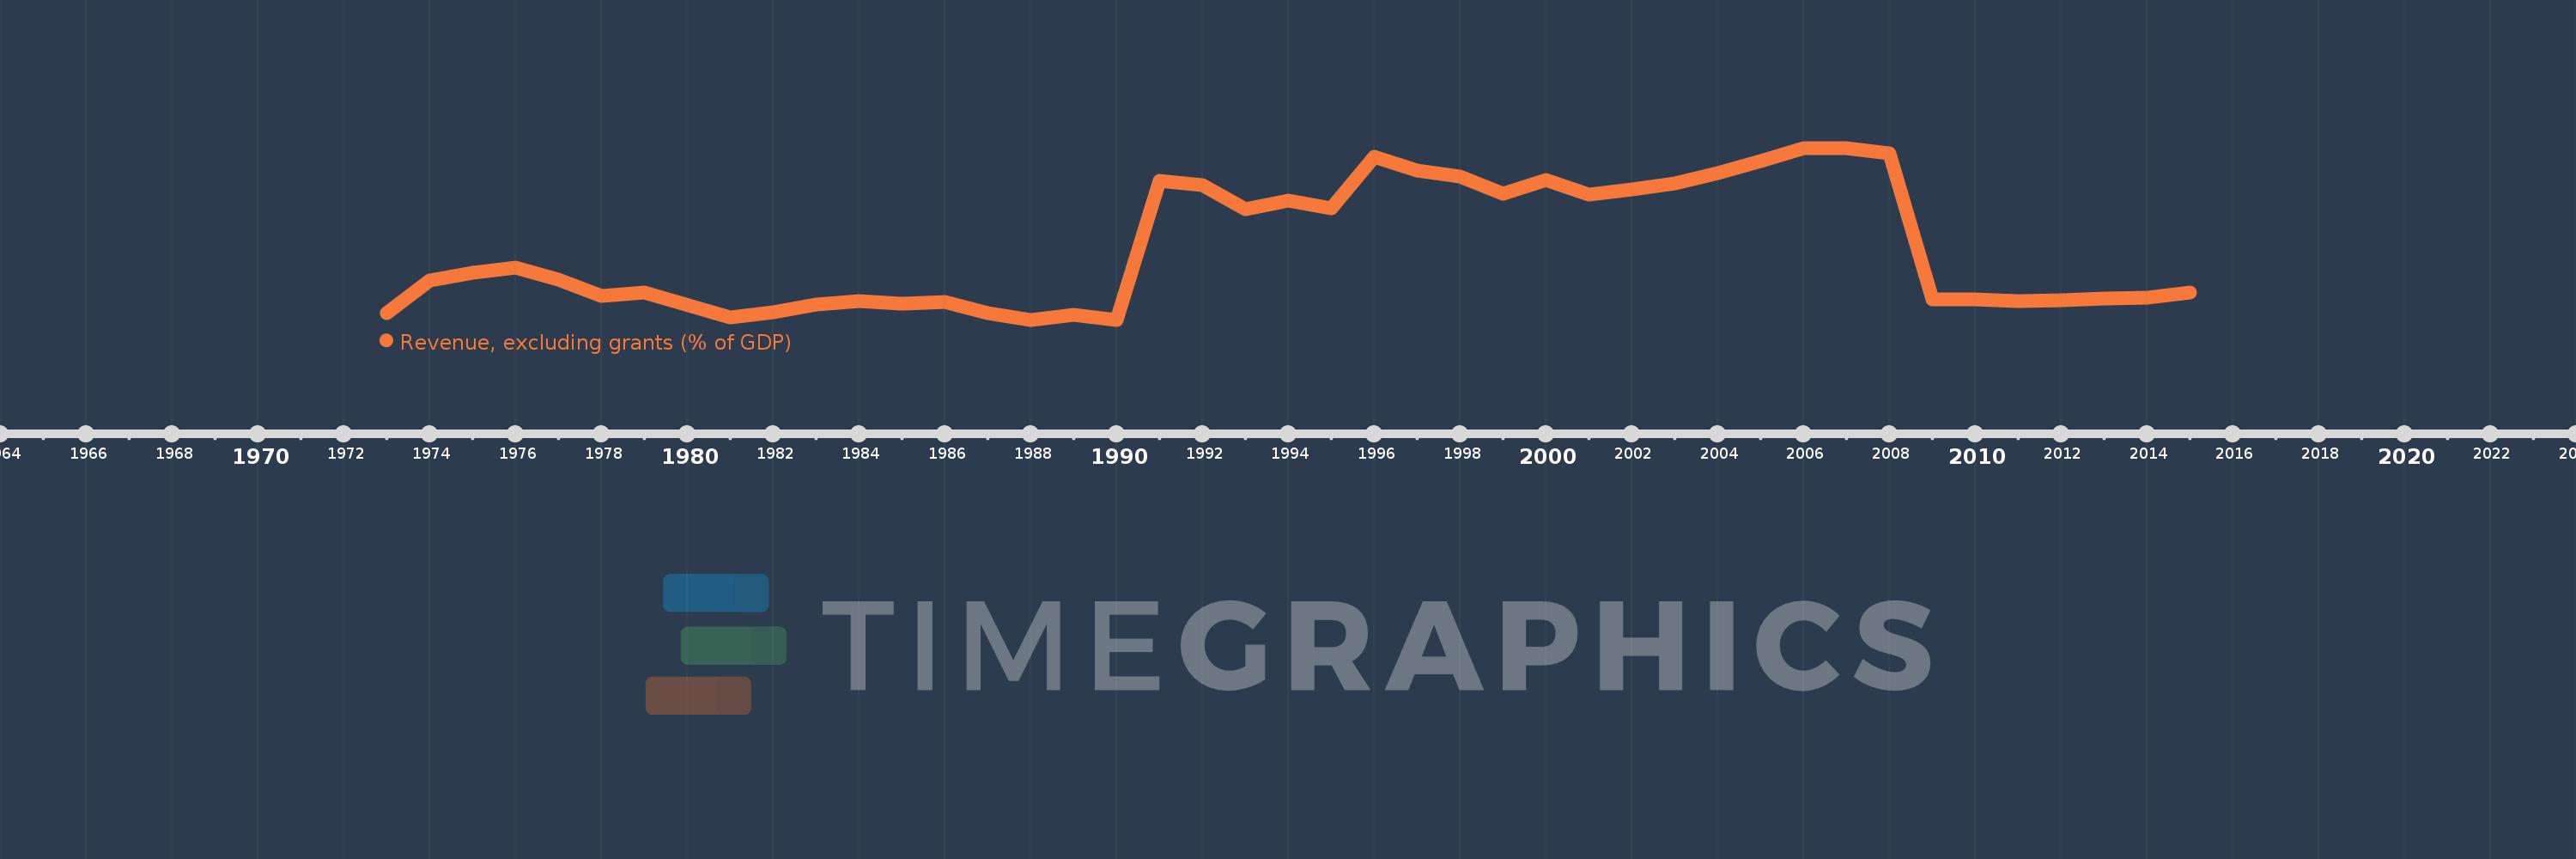
Revenue, excluding grants (% of GDP)
2015,2014,2013,2012,2011,2010,2009,2008,2007,2006,2005,2004,2003,2002,2001,2000,1999,1998,1997,1996,1995,1994,1993,1992,1991,1990,1989,1988,1987,1986,1985,1984,1983,1982,1981,1979,1978,1977,1976,1975,1974,1973
This statistics in other country:
AfghanistanAlbaniaAlgeriaAngolaAntigua and BarbudaArgentinaArmeniaAustraliaAustriaAzerbaijanBahamas, TheBahrainBangladeshBarbadosBelarusBelgiumBelizeBeninBhutanBoliviaBosnia and HerzegovinaBotswanaBrazilBulgariaBurkina FasoBurundiCabo VerdeCambodiaCanadaCaribbean small statesCentral African RepublicCentral Europe and the BalticsChileChinaColombiaCongo, Dem. Rep.Congo, Rep.Costa RicaCote d'IvoireCroatiaCyprusCzech RepublicDenmarkDominicaDominican RepublicEarly-demographic dividendEast Asia & PacificEast Asia & Pacific (excluding high income)East Asia & Pacific (IDA & IBRD countries)Egypt, Arab Rep.El SalvadorEquatorial GuineaEstoniaEthiopiaEuro areaEurope & Central AsiaEurope & Central Asia (excluding high income)Europe & Central Asia (IDA & IBRD countries)European UnionFijiFinlandFranceGambia, TheGeorgiaGermanyGhanaGreeceGrenadaGuatemalaHeavily indebted poor countries (HIPC)High incomeHondurasHong Kong SAR, ChinaHungaryIBRD onlyIcelandIDA & IBRD totalIDA blendIDA onlyIDA totalIndiaIndonesiaIran, Islamic Rep.IraqIrelandIsraelItalyJamaicaJapanJordanKazakhstanKenyaKiribatiKorea, Rep.KuwaitKyrgyz RepublicLao PDRLate-demographic dividendLatin America & Caribbean Latin America & Caribbean (excluding high income)Latin America & the Caribbean (IDA & IBRD countries)LatviaLeast developed countries: UN classificationLebanonLesothoLiberiaLithuaniaLow & middle incomeLow incomeLower middle incomeLuxembourgMacao SAR, ChinaMacedonia, FYRMadagascarMalawiMalaysiaMaldivesMaliMaltaMauritiusMexicoMicronesia, Fed. Sts.Middle East & North Africa (excluding high income)Middle East & North Africa (IDA & IBRD countries)Middle incomeMoldovaMongoliaMoroccoMozambiqueMyanmarNamibiaNepalNetherlandsNew ZealandNicaraguaNigeriaNorth AmericaNorwayOECD membersOmanOther small statesPacific island small statesPakistanPanamaPapua New GuineaParaguayPeruPhilippinesPolandPortugalPost-demographic dividendPre-demographic dividendQatarRomaniaRussian FederationRwandaSamoaSan MarinoSao Tome and PrincipeSenegalSerbiaSeychellesSierra LeoneSingaporeSlovak RepublicSloveniaSmall statesSolomon IslandsSouth AfricaSouth AsiaSouth Asia (IDA & IBRD)SpainSri LankaSt. Kitts and NevisSt. LuciaSt. Vincent and the GrenadinesSub-Saharan Africa Sub-Saharan Africa (excluding high income)Sub-Saharan Africa (IDA & IBRD countries)SurinameSwazilandSwedenSwitzerlandSyrian Arab RepublicTajikistanTanzaniaThailandTimor-LesteTogoTrinidad and TobagoTunisiaTurkeyUgandaUkraineUnited Arab EmiratesUnited KingdomUnited StatesUpper middle incomeUruguayVanuatuVenezuela, RBVietnamWest Bank and GazaWorldYemen, Rep.ZambiaZimbabwe Timeline:
This timeline shows a graph from 1973 to 2015 of Malta. No data until 1972. Number of actual observations by date: 42.
Source name:
World Development Indicators
Source organization:
International Monetary Fund, Government Finance Statistics Yearbook and data files, and World Bank and OECD GDP estimates.
Categories, topics:
Economy & Growth, Public Sector
Last updated:
apr 23, 2017
Indicators value changes by year
Minimum:
31.194
jan 1, 1988
Maximum:
92.169
jan 1, 2007
At the date of observation
Value
Absolute change
Change from previous value
jan 1, 1973
33.48
+33.48
0.0%
jan 1, 1974
44.986
+11.506
34.37%
jan 1, 1975
47.782
+2.796
6.21%
jan 1, 1976
49.747
+1.965
4.11%
jan 1, 1977
45.539
-4.208
-8.46%
jan 1, 1978
39.586
-5.953
-13.07%
jan 1, 1979
40.939
+1.353
3.42%
jan 1, 1981
32.136
-8.803
-21.5%
jan 1, 1982
33.974
+1.838
5.72%
jan 1, 1983
36.458
+2.484
7.31%
jan 1, 1984
37.822
+1.365
3.74%
jan 1, 1985
36.768
-1.055
-2.79%
jan 1, 1986
37.508
+0.74
2.01%
jan 1, 1987
33.602
-3.906
-10.41%
jan 1, 1988
31.194
-2.408
-7.17%
jan 1, 1989
32.892
+1.698
5.44%
jan 1, 1990
31.243
-1.648
-5.01%
jan 1, 1991
80.619
+49.375
158.04%
jan 1, 1992
78.982
-1.636
-2.03%
jan 1, 1993
70.454
-8.529
-10.8%
jan 1, 1994
73.352
+2.898
4.11%
jan 1, 1995
70.815
-2.537
-3.46%
jan 1, 1996
89.084
+18.269
25.8%
jan 1, 1997
84.08
-5.004
-5.62%
jan 1, 1998
82.122
-1.958
-2.33%
jan 1, 1999
75.93
-6.192
-7.54%
jan 1, 2000
80.722
+4.792
6.31%
jan 1, 2001
75.679
-5.043
-6.25%
jan 1, 2002
77.483
+1.804
2.38%
jan 1, 2003
79.587
+2.104
2.72%
jan 1, 2004
83.245
+3.658
4.6%
jan 1, 2005
87.562
+4.317
5.19%
jan 1, 2006
91.951
+4.389
5.01%
jan 1, 2007
92.169
+0.218
0.24%
jan 1, 2008
90.359
-1.81
-1.96%
jan 1, 2009
38.28
-52.079
-57.64%
jan 1, 2010
38.412
+0.133
0.35%
jan 1, 2011
37.68
-0.733
-1.91%
jan 1, 2012
38.23
+0.55
1.46%
jan 1, 2013
38.648
+0.418
1.09%
jan 1, 2014
39.031
+0.382
0.99%
jan 1, 2015
40.877
+1.847
4.73%
Ranking of countries by current statistics by years


Comments: