29
/
en
AIzaSyAYiBZKx7MnpbEhh9jyipgxe19OcubqV5w
April 1, 2024
119350
Denmark
DNK
true
2
1
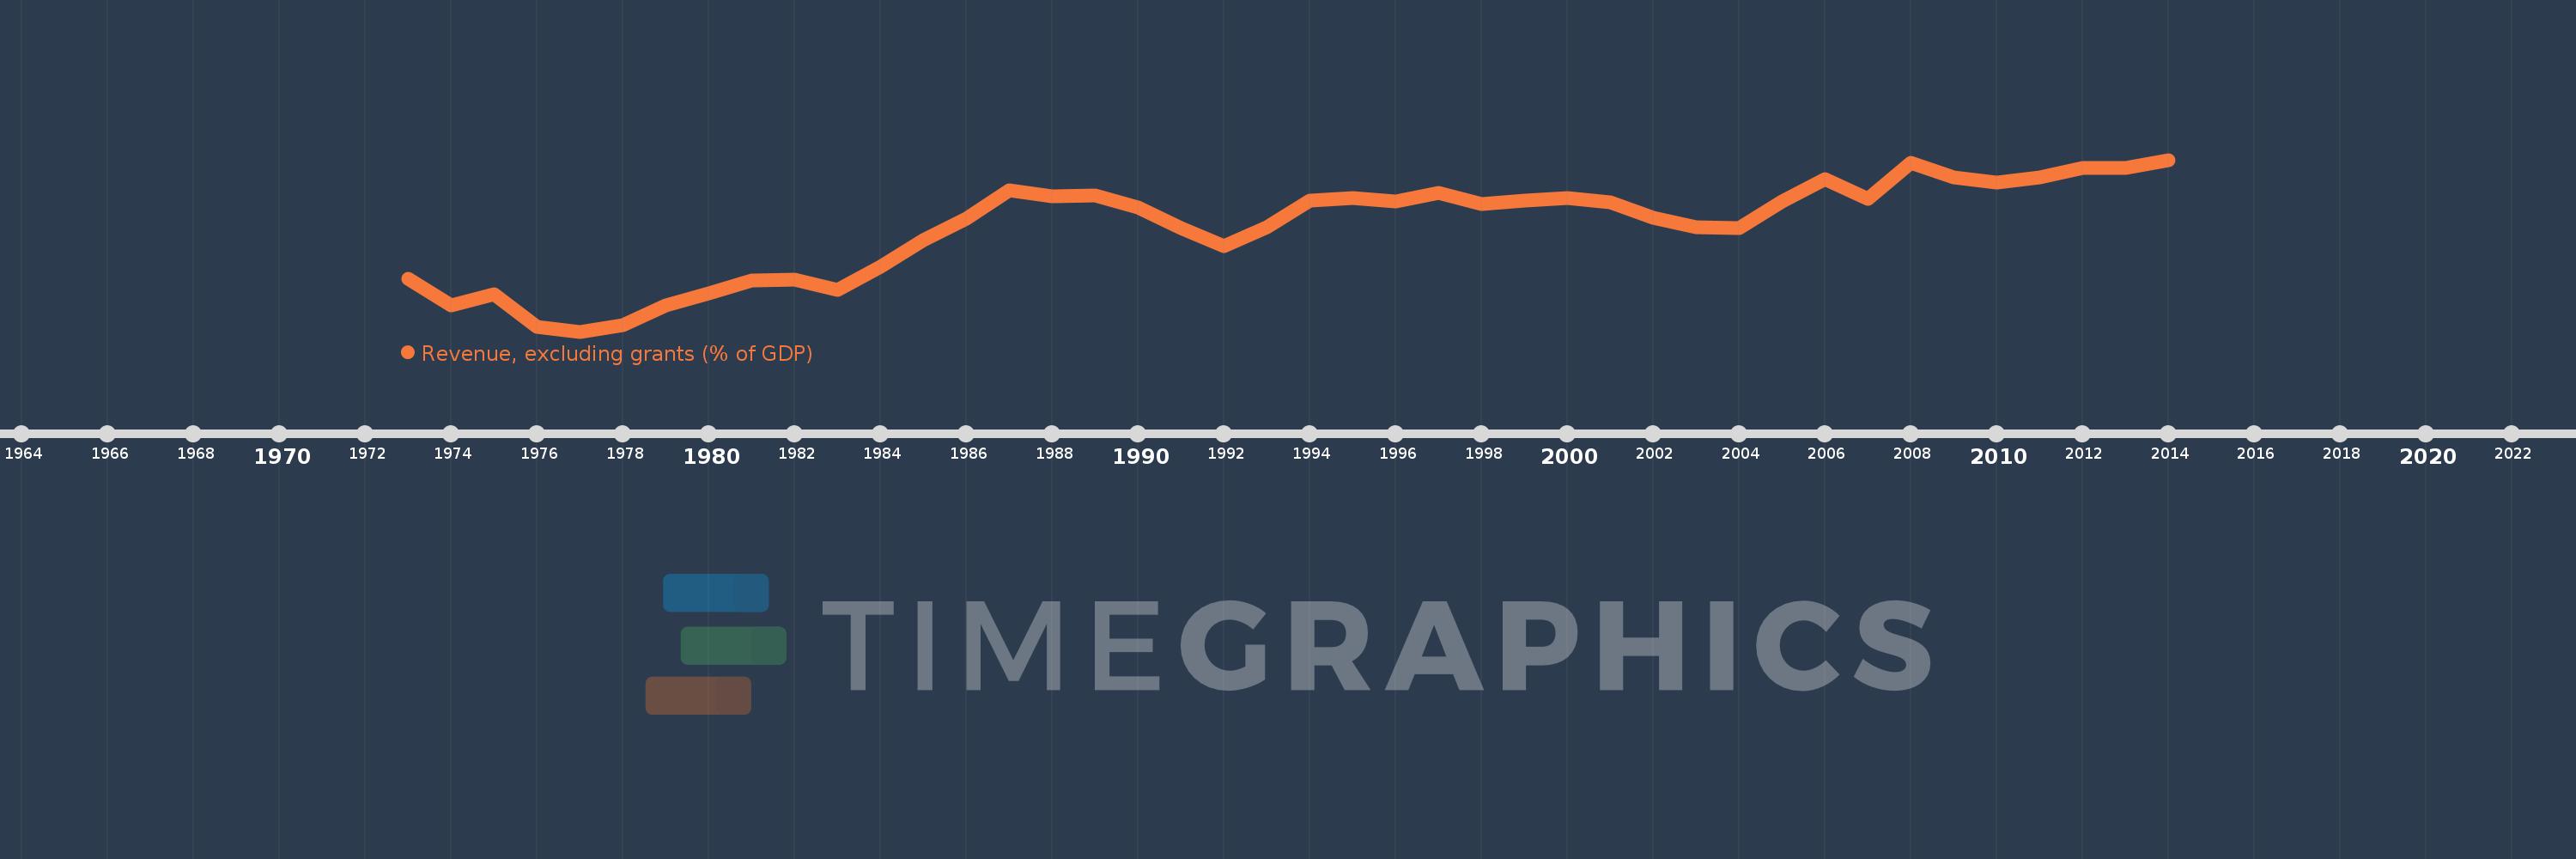
Revenue, excluding grants (% of GDP)
2014,2013,2012,2011,2010,2009,2008,2007,2006,2005,2004,2003,2002,2001,2000,1999,1998,1997,1996,1995,1994,1993,1992,1991,1990,1989,1988,1987,1986,1985,1984,1983,1982,1981,1980,1979,1978,1977,1976,1975,1974,1973
This statistics in other country:
AfghanistanAlbaniaAlgeriaAngolaAntigua and BarbudaArgentinaArmeniaAustraliaAustriaAzerbaijanBahamas, TheBahrainBangladeshBarbadosBelarusBelgiumBelizeBeninBhutanBoliviaBosnia and HerzegovinaBotswanaBrazilBulgariaBurkina FasoBurundiCabo VerdeCambodiaCanadaCaribbean small statesCentral African RepublicCentral Europe and the BalticsChileChinaColombiaCongo, Dem. Rep.Congo, Rep.Costa RicaCote d'IvoireCroatiaCyprusCzech RepublicDenmarkDominicaDominican RepublicEarly-demographic dividendEast Asia & PacificEast Asia & Pacific (excluding high income)East Asia & Pacific (IDA & IBRD countries)Egypt, Arab Rep.El SalvadorEquatorial GuineaEstoniaEthiopiaEuro areaEurope & Central AsiaEurope & Central Asia (excluding high income)Europe & Central Asia (IDA & IBRD countries)European UnionFijiFinlandFranceGambia, TheGeorgiaGermanyGhanaGreeceGrenadaGuatemalaHeavily indebted poor countries (HIPC)High incomeHondurasHong Kong SAR, ChinaHungaryIBRD onlyIcelandIDA & IBRD totalIDA blendIDA onlyIDA totalIndiaIndonesiaIran, Islamic Rep.IraqIrelandIsraelItalyJamaicaJapanJordanKazakhstanKenyaKiribatiKorea, Rep.KuwaitKyrgyz RepublicLao PDRLate-demographic dividendLatin America & Caribbean Latin America & Caribbean (excluding high income)Latin America & the Caribbean (IDA & IBRD countries)LatviaLeast developed countries: UN classificationLebanonLesothoLiberiaLithuaniaLow & middle incomeLow incomeLower middle incomeLuxembourgMacao SAR, ChinaMacedonia, FYRMadagascarMalawiMalaysiaMaldivesMaliMaltaMauritiusMexicoMicronesia, Fed. Sts.Middle East & North Africa (excluding high income)Middle East & North Africa (IDA & IBRD countries)Middle incomeMoldovaMongoliaMoroccoMozambiqueMyanmarNamibiaNepalNetherlandsNew ZealandNicaraguaNigeriaNorth AmericaNorwayOECD membersOmanOther small statesPacific island small statesPakistanPanamaPapua New GuineaParaguayPeruPhilippinesPolandPortugalPost-demographic dividendPre-demographic dividendQatarRomaniaRussian FederationRwandaSamoaSan MarinoSao Tome and PrincipeSenegalSerbiaSeychellesSierra LeoneSingaporeSlovak RepublicSloveniaSmall statesSolomon IslandsSouth AfricaSouth AsiaSouth Asia (IDA & IBRD)SpainSri LankaSt. Kitts and NevisSt. LuciaSt. Vincent and the GrenadinesSub-Saharan Africa Sub-Saharan Africa (excluding high income)Sub-Saharan Africa (IDA & IBRD countries)SurinameSwazilandSwedenSwitzerlandSyrian Arab RepublicTajikistanTanzaniaThailandTimor-LesteTogoTrinidad and TobagoTunisiaTurkeyUgandaUkraineUnited Arab EmiratesUnited KingdomUnited StatesUpper middle incomeUruguayVanuatuVenezuela, RBVietnamWest Bank and GazaWorldYemen, Rep.ZambiaZimbabwe Timeline:
This timeline shows a graph from 1973 to 2014 of Denmark. No data until 1972. Number of actual observations by date: 42.
Source name:
World Development Indicators
Source organization:
International Monetary Fund, Government Finance Statistics Yearbook and data files, and World Bank and OECD GDP estimates.
Categories, topics:
Economy & Growth, Public Sector
Last updated:
apr 23, 2017
Indicators value changes by year
Minimum:
29.798
jan 1, 1977
At the date of observation
Value
Absolute change
Change from previous value
jan 1, 1973
33.328
+33.328
0.0%
jan 1, 1974
31.539
-1.79
-5.37%
jan 1, 1975
32.286
+0.747
2.37%
jan 1, 1976
30.113
-2.173
-6.73%
jan 1, 1977
29.798
-0.315
-1.05%
jan 1, 1978
30.256
+0.458
1.54%
jan 1, 1979
31.586
+1.329
4.39%
jan 1, 1980
32.382
+0.796
2.52%
jan 1, 1981
33.233
+0.851
2.63%
jan 1, 1982
33.272
+0.04
0.12%
jan 1, 1983
32.621
-0.652
-1.96%
jan 1, 1984
34.15
+1.53
4.69%
jan 1, 1985
35.947
+1.796
5.26%
jan 1, 1986
37.39
+1.443
4.02%
jan 1, 1987
39.272
+1.882
5.03%
jan 1, 1988
38.869
-0.403
-1.03%
jan 1, 1989
38.964
+0.095
0.24%
jan 1, 1990
38.151
-0.813
-2.09%
jan 1, 1991
36.741
-1.41
-3.7%
jan 1, 1992
35.562
-1.179
-3.21%
jan 1, 1993
36.797
+1.235
3.47%
jan 1, 1994
38.61
+1.813
4.93%
jan 1, 1995
38.787
+0.176
0.46%
jan 1, 1996
38.548
-0.239
-0.62%
jan 1, 1997
39.122
+0.574
1.49%
jan 1, 1998
38.396
-0.727
-1.86%
jan 1, 1999
38.587
+0.192
0.5%
jan 1, 2000
38.758
+0.171
0.44%
jan 1, 2001
38.478
-0.28
-0.72%
jan 1, 2002
37.466
-1.012
-2.63%
jan 1, 2003
36.835
-0.631
-1.68%
jan 1, 2004
36.738
-0.098
-0.26%
jan 1, 2005
38.526
+1.788
4.87%
jan 1, 2006
40.045
+1.519
3.94%
jan 1, 2007
38.693
-1.352
-3.38%
jan 1, 2008
41.16
+2.467
6.38%
jan 1, 2009
40.176
-0.984
-2.39%
jan 1, 2010
39.812
-0.364
-0.9%
jan 1, 2011
40.131
+0.319
0.8%
jan 1, 2012
40.803
+0.672
1.67%
jan 1, 2013
40.803
+0.001
0.0%
jan 1, 2014
41.34
+0.536
1.31%
Ranking of countries by current statistics by years


Comments: