29
/
en
AIzaSyAYiBZKx7MnpbEhh9jyipgxe19OcubqV5w
April 1, 2024
155289
India
IND
true
2
1
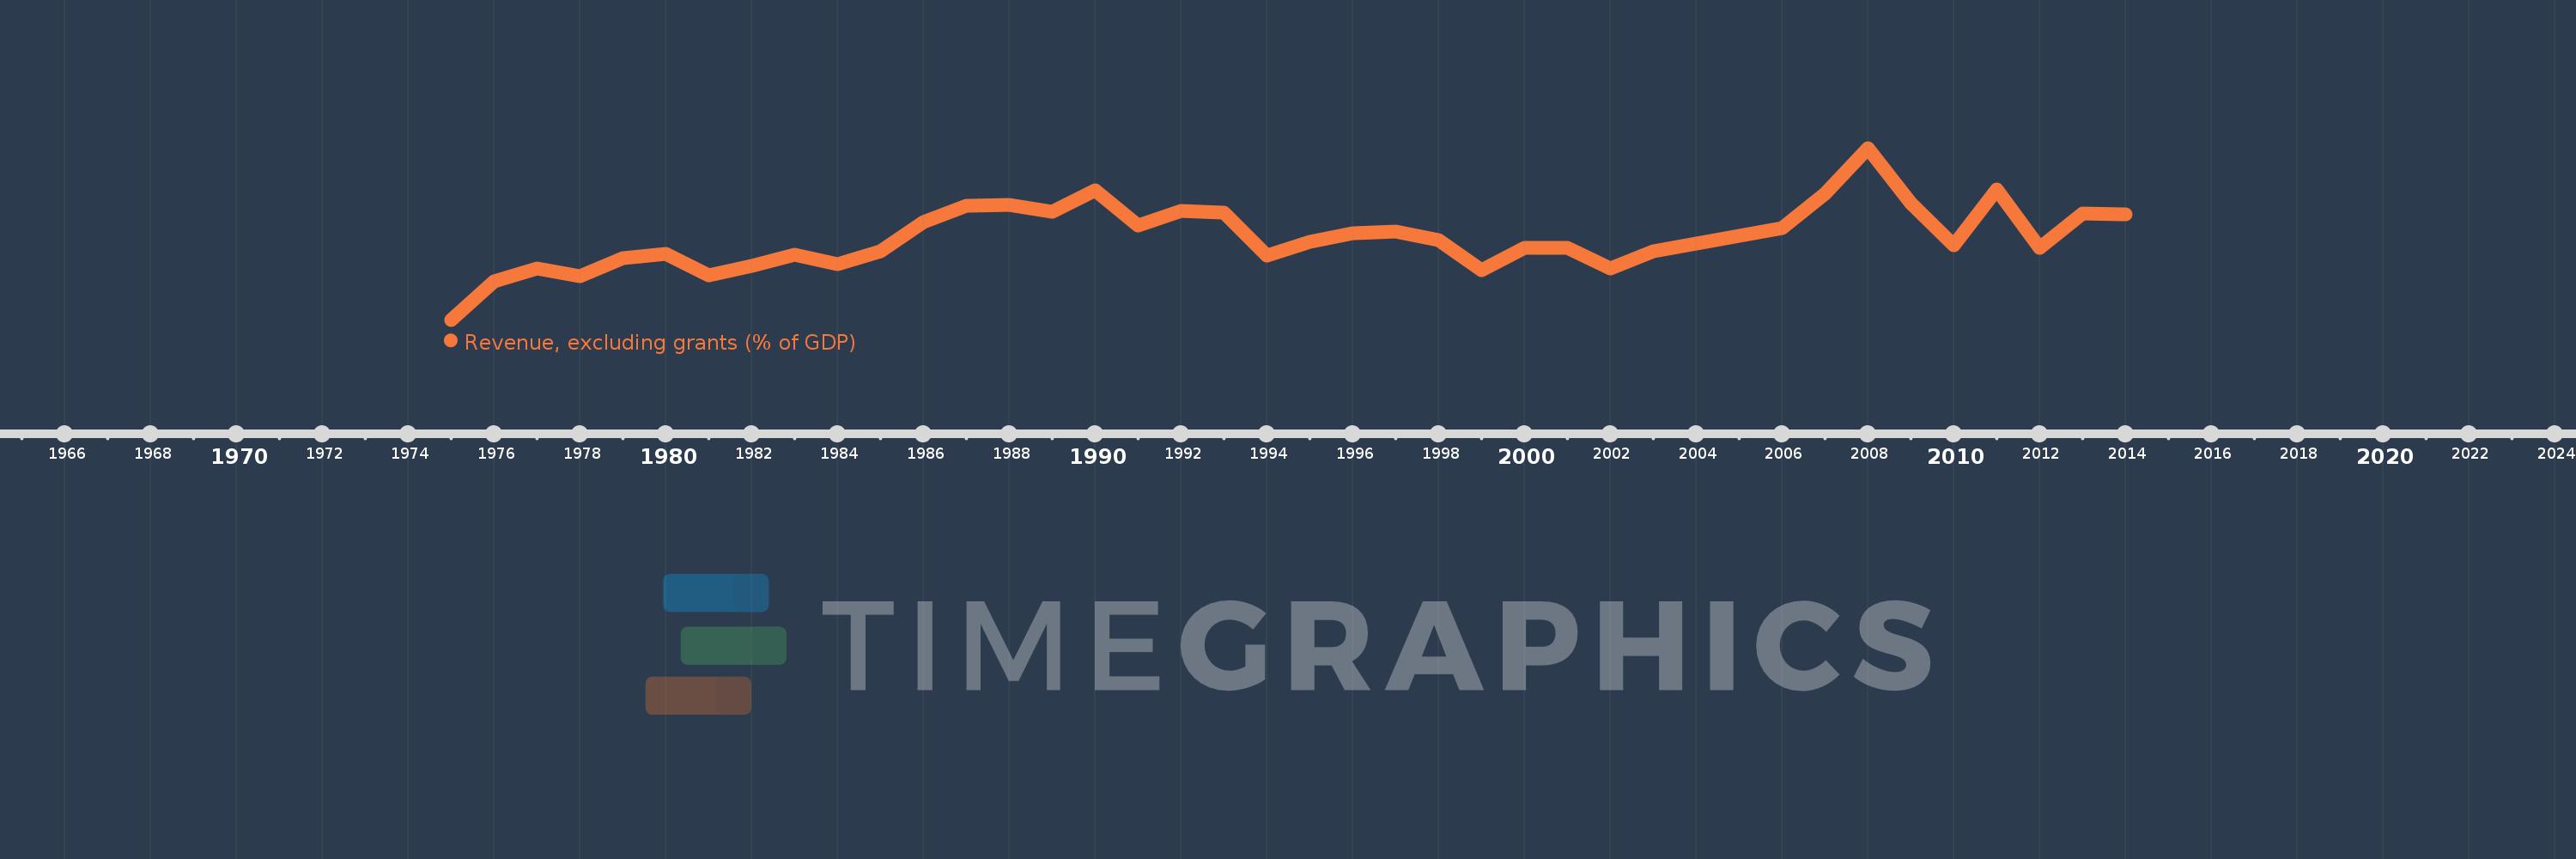
Revenue, excluding grants (% of GDP)
2014,2013,2012,2011,2010,2009,2008,2007,2006,2005,2004,2003,2002,2001,2000,1999,1998,1997,1996,1995,1994,1993,1992,1991,1990,1989,1988,1987,1986,1985,1984,1983,1982,1981,1980,1979,1978,1977,1976,1975
This statistics in other country:
AfghanistanAlbaniaAlgeriaAngolaAntigua and BarbudaArgentinaArmeniaAustraliaAustriaAzerbaijanBahamas, TheBahrainBangladeshBarbadosBelarusBelgiumBelizeBeninBhutanBoliviaBosnia and HerzegovinaBotswanaBrazilBulgariaBurkina FasoBurundiCabo VerdeCambodiaCanadaCaribbean small statesCentral African RepublicCentral Europe and the BalticsChileChinaColombiaCongo, Dem. Rep.Congo, Rep.Costa RicaCote d'IvoireCroatiaCyprusCzech RepublicDenmarkDominicaDominican RepublicEarly-demographic dividendEast Asia & PacificEast Asia & Pacific (excluding high income)East Asia & Pacific (IDA & IBRD countries)Egypt, Arab Rep.El SalvadorEquatorial GuineaEstoniaEthiopiaEuro areaEurope & Central AsiaEurope & Central Asia (excluding high income)Europe & Central Asia (IDA & IBRD countries)European UnionFijiFinlandFranceGambia, TheGeorgiaGermanyGhanaGreeceGrenadaGuatemalaHeavily indebted poor countries (HIPC)High incomeHondurasHong Kong SAR, ChinaHungaryIBRD onlyIcelandIDA & IBRD totalIDA blendIDA onlyIDA totalIndiaIndonesiaIran, Islamic Rep.IraqIrelandIsraelItalyJamaicaJapanJordanKazakhstanKenyaKiribatiKorea, Rep.KuwaitKyrgyz RepublicLao PDRLate-demographic dividendLatin America & Caribbean Latin America & Caribbean (excluding high income)Latin America & the Caribbean (IDA & IBRD countries)LatviaLeast developed countries: UN classificationLebanonLesothoLiberiaLithuaniaLow & middle incomeLow incomeLower middle incomeLuxembourgMacao SAR, ChinaMacedonia, FYRMadagascarMalawiMalaysiaMaldivesMaliMaltaMauritiusMexicoMicronesia, Fed. Sts.Middle East & North Africa (excluding high income)Middle East & North Africa (IDA & IBRD countries)Middle incomeMoldovaMongoliaMoroccoMozambiqueMyanmarNamibiaNepalNetherlandsNew ZealandNicaraguaNigeriaNorth AmericaNorwayOECD membersOmanOther small statesPacific island small statesPakistanPanamaPapua New GuineaParaguayPeruPhilippinesPolandPortugalPost-demographic dividendPre-demographic dividendQatarRomaniaRussian FederationRwandaSamoaSan MarinoSao Tome and PrincipeSenegalSerbiaSeychellesSierra LeoneSingaporeSlovak RepublicSloveniaSmall statesSolomon IslandsSouth AfricaSouth AsiaSouth Asia (IDA & IBRD)SpainSri LankaSt. Kitts and NevisSt. LuciaSt. Vincent and the GrenadinesSub-Saharan Africa Sub-Saharan Africa (excluding high income)Sub-Saharan Africa (IDA & IBRD countries)SurinameSwazilandSwedenSwitzerlandSyrian Arab RepublicTajikistanTanzaniaThailandTimor-LesteTogoTrinidad and TobagoTunisiaTurkeyUgandaUkraineUnited Arab EmiratesUnited KingdomUnited StatesUpper middle incomeUruguayVanuatuVenezuela, RBVietnamWest Bank and GazaWorldYemen, Rep.ZambiaZimbabwe Timeline:
This timeline shows a graph from 1975 to 2014 of India. No data until 1974. Number of actual observations by date: 40.
Source name:
World Development Indicators
Source organization:
International Monetary Fund, Government Finance Statistics Yearbook and data files, and World Bank and OECD GDP estimates.
Categories, topics:
Economy & Growth, Public Sector
Last updated:
apr 23, 2017
Indicators value changes by year
Maximum:
14.628
jan 1, 2008
At the date of observation
Value
Absolute change
Change from previous value
jan 1, 1975
9.26
+9.26
0.0%
jan 1, 1976
10.473
+1.214
13.11%
jan 1, 1977
10.865
+0.391
3.74%
jan 1, 1978
10.614
-0.25
-2.3%
jan 1, 1979
11.181
+0.567
5.34%
jan 1, 1980
11.323
+0.142
1.27%
jan 1, 1981
10.639
-0.683
-6.04%
jan 1, 1982
10.949
+0.31
2.91%
jan 1, 1983
11.286
+0.337
3.08%
jan 1, 1984
10.986
-0.301
-2.66%
jan 1, 1985
11.388
+0.402
3.66%
jan 1, 1986
12.311
+0.923
8.11%
jan 1, 1987
12.833
+0.522
4.24%
jan 1, 1988
12.842
+0.009
0.07%
jan 1, 1989
12.626
-0.216
-1.68%
jan 1, 1990
13.31
+0.684
5.42%
jan 1, 1991
12.212
-1.098
-8.25%
jan 1, 1992
12.663
+0.451
3.69%
jan 1, 1993
12.597
-0.065
-0.52%
jan 1, 1994
11.278
-1.32
-10.48%
jan 1, 1995
11.687
+0.41
3.63%
jan 1, 1996
11.954
+0.267
2.29%
jan 1, 1997
12.027
+0.073
0.61%
jan 1, 1998
11.754
-0.273
-2.27%
jan 1, 1999
10.801
-0.953
-8.11%
jan 1, 2000
11.502
+0.701
6.49%
jan 1, 2001
11.502
+0.0
0.0%
jan 1, 2002
10.85
-0.652
-5.67%
jan 1, 2003
11.394
+0.545
5.02%
jan 1, 2004
11.649
+0.255
2.23%
jan 1, 2005
11.875
+0.226
1.94%
jan 1, 2006
12.131
+0.256
2.15%
jan 1, 2007
13.193
+1.062
8.75%
jan 1, 2008
14.628
+1.435
10.88%
jan 1, 2009
12.889
-1.739
-11.89%
jan 1, 2010
11.575
-1.313
-10.19%
jan 1, 2011
13.335
+1.76
15.2%
jan 1, 2012
11.496
-1.839
-13.79%
jan 1, 2013
12.591
+1.094
9.52%
jan 1, 2014
12.565
-0.025
-0.2%
Ranking of countries by current statistics by years


Comments: