29
/
en
AIzaSyAYiBZKx7MnpbEhh9jyipgxe19OcubqV5w
April 1, 2024
182517
Luxembourg
LUX
true
2
1
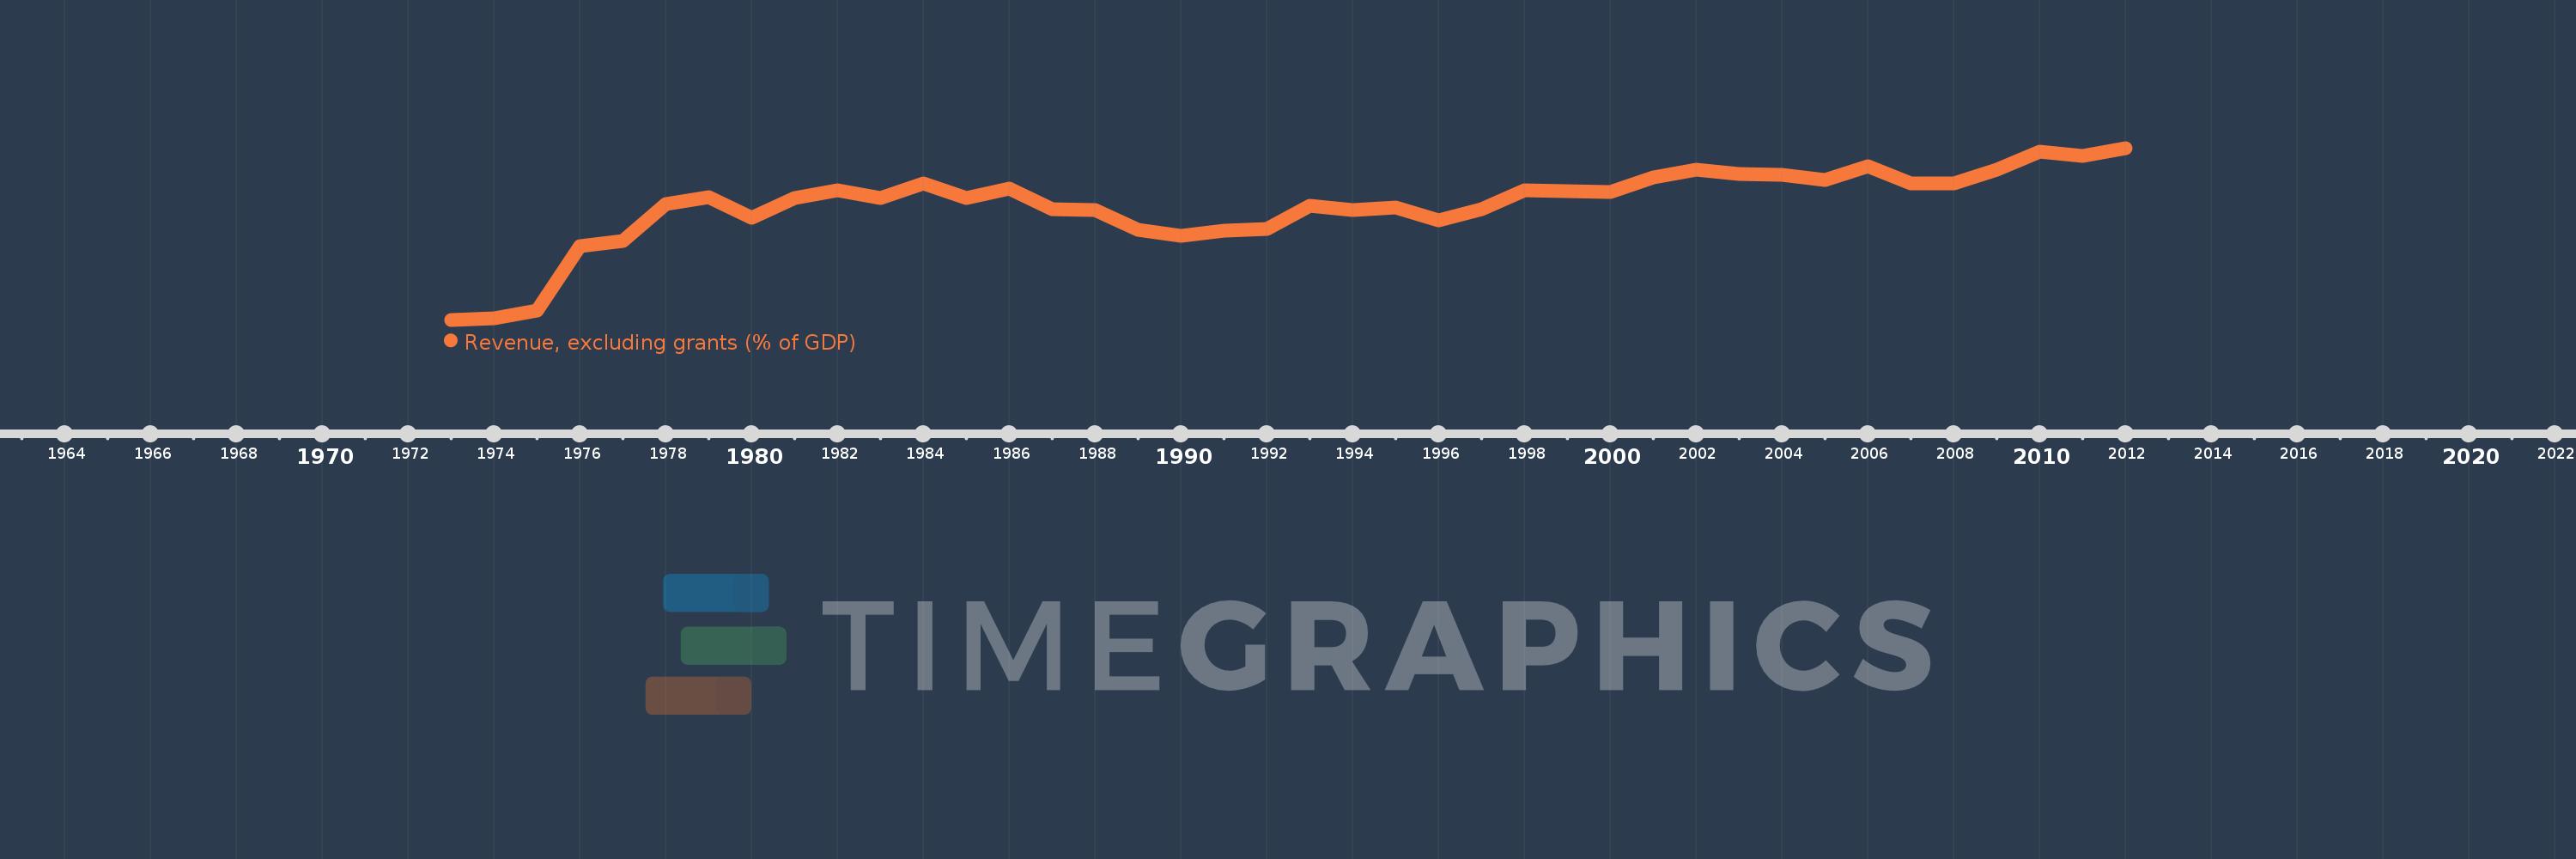
Revenue, excluding grants (% of GDP)
2012,2011,2010,2009,2008,2007,2006,2005,2004,2003,2002,2001,2000,1998,1997,1996,1995,1994,1993,1992,1991,1990,1989,1988,1987,1986,1985,1984,1983,1982,1981,1980,1979,1978,1977,1976,1975,1974,1973
This statistics in other country:
AfghanistanAlbaniaAlgeriaAngolaAntigua and BarbudaArgentinaArmeniaAustraliaAustriaAzerbaijanBahamas, TheBahrainBangladeshBarbadosBelarusBelgiumBelizeBeninBhutanBoliviaBosnia and HerzegovinaBotswanaBrazilBulgariaBurkina FasoBurundiCabo VerdeCambodiaCanadaCaribbean small statesCentral African RepublicCentral Europe and the BalticsChileChinaColombiaCongo, Dem. Rep.Congo, Rep.Costa RicaCote d'IvoireCroatiaCyprusCzech RepublicDenmarkDominicaDominican RepublicEarly-demographic dividendEast Asia & PacificEast Asia & Pacific (excluding high income)East Asia & Pacific (IDA & IBRD countries)Egypt, Arab Rep.El SalvadorEquatorial GuineaEstoniaEthiopiaEuro areaEurope & Central AsiaEurope & Central Asia (excluding high income)Europe & Central Asia (IDA & IBRD countries)European UnionFijiFinlandFranceGambia, TheGeorgiaGermanyGhanaGreeceGrenadaGuatemalaHeavily indebted poor countries (HIPC)High incomeHondurasHong Kong SAR, ChinaHungaryIBRD onlyIcelandIDA & IBRD totalIDA blendIDA onlyIDA totalIndiaIndonesiaIran, Islamic Rep.IraqIrelandIsraelItalyJamaicaJapanJordanKazakhstanKenyaKiribatiKorea, Rep.KuwaitKyrgyz RepublicLao PDRLate-demographic dividendLatin America & Caribbean Latin America & Caribbean (excluding high income)Latin America & the Caribbean (IDA & IBRD countries)LatviaLeast developed countries: UN classificationLebanonLesothoLiberiaLithuaniaLow & middle incomeLow incomeLower middle incomeLuxembourgMacao SAR, ChinaMacedonia, FYRMadagascarMalawiMalaysiaMaldivesMaliMaltaMauritiusMexicoMicronesia, Fed. Sts.Middle East & North Africa (excluding high income)Middle East & North Africa (IDA & IBRD countries)Middle incomeMoldovaMongoliaMoroccoMozambiqueMyanmarNamibiaNepalNetherlandsNew ZealandNicaraguaNigeriaNorth AmericaNorwayOECD membersOmanOther small statesPacific island small statesPakistanPanamaPapua New GuineaParaguayPeruPhilippinesPolandPortugalPost-demographic dividendPre-demographic dividendQatarRomaniaRussian FederationRwandaSamoaSan MarinoSao Tome and PrincipeSenegalSerbiaSeychellesSierra LeoneSingaporeSlovak RepublicSloveniaSmall statesSolomon IslandsSouth AfricaSouth AsiaSouth Asia (IDA & IBRD)SpainSri LankaSt. Kitts and NevisSt. LuciaSt. Vincent and the GrenadinesSub-Saharan Africa Sub-Saharan Africa (excluding high income)Sub-Saharan Africa (IDA & IBRD countries)SurinameSwazilandSwedenSwitzerlandSyrian Arab RepublicTajikistanTanzaniaThailandTimor-LesteTogoTrinidad and TobagoTunisiaTurkeyUgandaUkraineUnited Arab EmiratesUnited KingdomUnited StatesUpper middle incomeUruguayVanuatuVenezuela, RBVietnamWest Bank and GazaWorldYemen, Rep.ZambiaZimbabwe Timeline:
This timeline shows a graph from 1973 to 2012 of Luxembourg. No data until 1972. Number of actual observations by date: 39.
Source name:
World Development Indicators
Source organization:
International Monetary Fund, Government Finance Statistics Yearbook and data files, and World Bank and OECD GDP estimates.
Categories, topics:
Economy & Growth, Public Sector
Last updated:
apr 23, 2017
Indicators value changes by year
Minimum:
25.908
jan 1, 1973
Maximum:
40.821
jan 1, 2012
At the date of observation
Value
Absolute change
Change from previous value
jan 1, 1973
25.908
+25.908
0.0%
jan 1, 1974
26.062
+0.154
0.6%
jan 1, 1975
26.692
+0.629
2.42%
jan 1, 1976
32.327
+5.635
21.11%
jan 1, 1977
32.718
+0.391
1.21%
jan 1, 1978
35.955
+3.236
9.89%
jan 1, 1979
36.535
+0.58
1.61%
jan 1, 1980
34.759
-1.777
-4.86%
jan 1, 1981
36.449
+1.691
4.86%
jan 1, 1982
37.156
+0.706
1.94%
jan 1, 1983
36.501
-0.655
-1.76%
jan 1, 1984
37.75
+1.249
3.42%
jan 1, 1985
36.457
-1.293
-3.42%
jan 1, 1986
37.272
+0.815
2.23%
jan 1, 1987
35.48
-1.792
-4.81%
jan 1, 1988
35.457
-0.023
-0.06%
jan 1, 1989
33.747
-1.71
-4.82%
jan 1, 1990
33.183
-0.564
-1.67%
jan 1, 1991
33.665
+0.482
1.45%
jan 1, 1992
33.811
+0.146
0.43%
jan 1, 1993
35.77
+1.959
5.8%
jan 1, 1994
35.43
-0.34
-0.95%
jan 1, 1995
35.62
+0.189
0.53%
jan 1, 1996
34.529
-1.091
-3.06%
jan 1, 1997
35.472
+0.943
2.73%
jan 1, 1998
37.108
+1.636
4.61%
jan 1, 2000
36.988
-0.12
-0.32%
jan 1, 2001
38.271
+1.283
3.47%
jan 1, 2002
38.948
+0.677
1.77%
jan 1, 2003
38.538
-0.41
-1.05%
jan 1, 2004
38.463
-0.076
-0.2%
jan 1, 2005
38.064
-0.399
-1.04%
jan 1, 2006
39.232
+1.168
3.07%
jan 1, 2007
37.706
-1.526
-3.89%
jan 1, 2008
37.748
+0.042
0.11%
jan 1, 2009
38.926
+1.177
3.12%
jan 1, 2010
40.495
+1.57
4.03%
jan 1, 2011
40.117
-0.378
-0.93%
jan 1, 2012
40.821
+0.704
1.75%
Ranking of countries by current statistics by years


Comments: