29
/
en
AIzaSyAYiBZKx7MnpbEhh9jyipgxe19OcubqV5w
April 1, 2024
67714
Angola
AGO
true
2
1
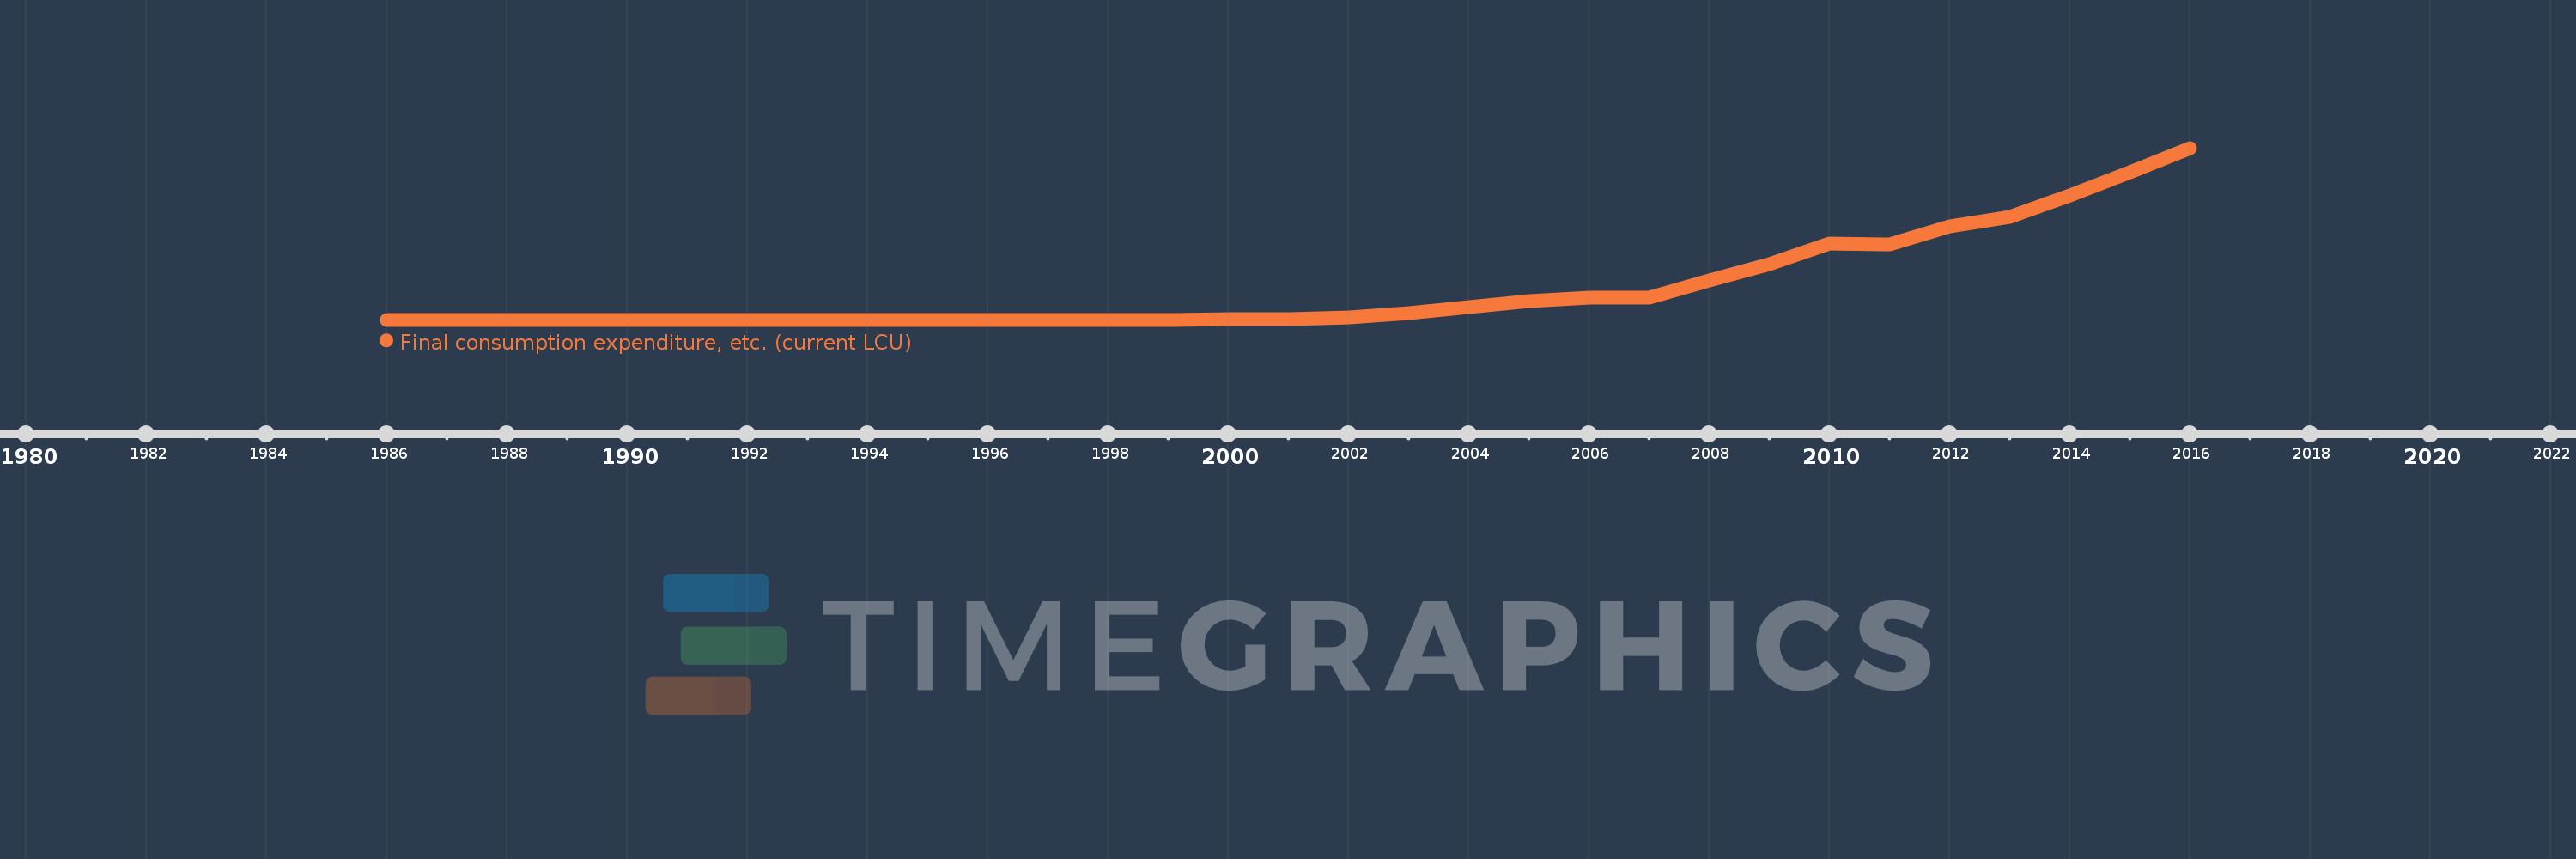
Final consumption expenditure, etc. (current LCU)
2016,2015,2014,2013,2012,2011,2010,2009,2008,2007,2006,2005,2004,2003,2002,2001,2000,1999,1998,1997,1995,1994,1993,1992,1991,1990,1989,1988,1987,1986
This statistics in other country:
AfghanistanAlbaniaAlgeriaAngolaAntigua and BarbudaArgentinaArmeniaArubaAustraliaAustriaAzerbaijanBahamas, TheBahrainBangladeshBarbadosBelarusBelgiumBelizeBeninBermudaBhutanBoliviaBosnia and HerzegovinaBotswanaBrazilBrunei DarussalamBulgariaBurkina FasoBurundiCabo VerdeCambodiaCameroonCanadaCentral African RepublicChadChileChinaColombiaComorosCongo, Dem. Rep.Congo, Rep.Costa RicaCote d'IvoireCroatiaCubaCyprusCzech RepublicDenmarkDjiboutiDominicaDominican RepublicEcuadorEgypt, Arab Rep.El SalvadorEquatorial GuineaEritreaEstoniaEthiopiaFaroe IslandsFijiFinlandFranceGabonGambia, TheGeorgiaGermanyGhanaGreeceGrenadaGuatemalaGuineaGuinea-BissauGuyanaHaitiHondurasHong Kong SAR, ChinaHungaryIcelandIndiaIndonesiaIran, Islamic Rep.IraqIrelandIsraelItalyJamaicaJapanJordanKazakhstanKenyaKiribatiKorea, Rep.KosovoKuwaitKyrgyz RepublicLao PDRLatviaLebanonLesothoLiberiaLibyaLithuaniaLuxembourgMacao SAR, ChinaMacedonia, FYRMadagascarMalawiMalaysiaMaldivesMaliMaltaMauritaniaMauritiusMexicoMicronesia, Fed. Sts.MoldovaMongoliaMontenegroMoroccoMozambiqueNamibiaNepalNetherlandsNew CaledoniaNew ZealandNicaraguaNigerNigeriaNorwayOmanPakistanPanamaPapua New GuineaParaguayPeruPhilippinesPolandPortugalPuerto RicoQatarRomaniaRussian FederationRwandaSaudi ArabiaSenegalSerbiaSeychellesSierra LeoneSingaporeSlovak RepublicSloveniaSolomon IslandsSomaliaSouth AfricaSouth SudanSpainSri LankaSt. Kitts and NevisSt. LuciaSt. Vincent and the GrenadinesSudanSurinameSwazilandSwedenSwitzerlandSyrian Arab RepublicTajikistanTanzaniaThailandTimor-LesteTogoTongaTrinidad and TobagoTunisiaTurkeyTurkmenistanUgandaUkraineUnited Arab EmiratesUnited KingdomUnited StatesUruguayUzbekistanVanuatuVenezuela, RBVietnamWest Bank and GazaYemen, Rep.ZambiaZimbabwe Timeline:
This timeline shows a graph from 1986 to 2016 of Angola. No data until 1985. Number of actual observations by date: 30.
Source name:
World Development Indicators
Source organization:
World Bank national accounts data, and OECD National Accounts data files.
Categories, topics:
Economy & Growth
Last updated:
apr 23, 2017
Indicators value changes by year
Maximum:
11.468 trl
jan 1, 2016
At the date of observation
Value
Absolute change
Change from previous value
jan 1, 1986
200.0
+200.0
0.0%
jan 1, 1987
200.0
0.0
0.0%
jan 1, 1988
200.0
0.0
0.0%
jan 1, 1989
200.0
0.0
0.0%
jan 1, 1990
300.0
+100.0
50.0%
jan 1, 1991
300.0
0.0
0.0%
jan 1, 1992
700.0
+400.0
133.33%
jan 1, 1993
2.6K
+1.9K
271.43%
jan 1, 1994
24.3K
+21.7K
834.62%
jan 1, 1995
458.3K
+434.0K
1.79K%
jan 1, 1997
433.149 mln
+432.691 mln
94.41K%
jan 1, 1998
1.316 bln
+882.967 mln
203.85%
jan 1, 1999
2.045 bln
+728.545 mln
55.36%
jan 1, 2000
13.308 bln
+11.263 bln
550.85%
jan 1, 2001
55.407 bln
+42.1 bln
316.36%
jan 1, 2002
169.725 bln
+114.318 bln
206.32%
jan 1, 2003
416.481 bln
+246.756 bln
145.39%
jan 1, 2004
854.926 bln
+438.445 bln
105.27%
jan 1, 2005
1.226 trl
+371.225 bln
43.42%
jan 1, 2006
1.448 trl
+221.821 bln
18.09%
jan 1, 2007
1.472 trl
+23.761 bln
1.64%
jan 1, 2008
2.599 trl
+1.127 trl
76.6%
jan 1, 2009
3.707 trl
+1.108 trl
42.63%
jan 1, 2010
5.107 trl
+1.4 trl
37.76%
jan 1, 2011
5.012 trl
-94.332 bln
-1.85%
jan 1, 2012
6.25 trl
+1.238 trl
24.69%
jan 1, 2013
6.882 trl
+631.612 bln
10.11%
jan 1, 2014
8.318 trl
+1.436 trl
20.87%
jan 1, 2015
9.829 trl
+1.511 trl
18.17%
jan 1, 2016
11.468 trl
+1.638 trl
16.67%
Ranking of countries by current statistics by years


Comments: