29
/
en
AIzaSyAYiBZKx7MnpbEhh9jyipgxe19OcubqV5w
April 1, 2024
108484
Comoros
COM
true
2
1
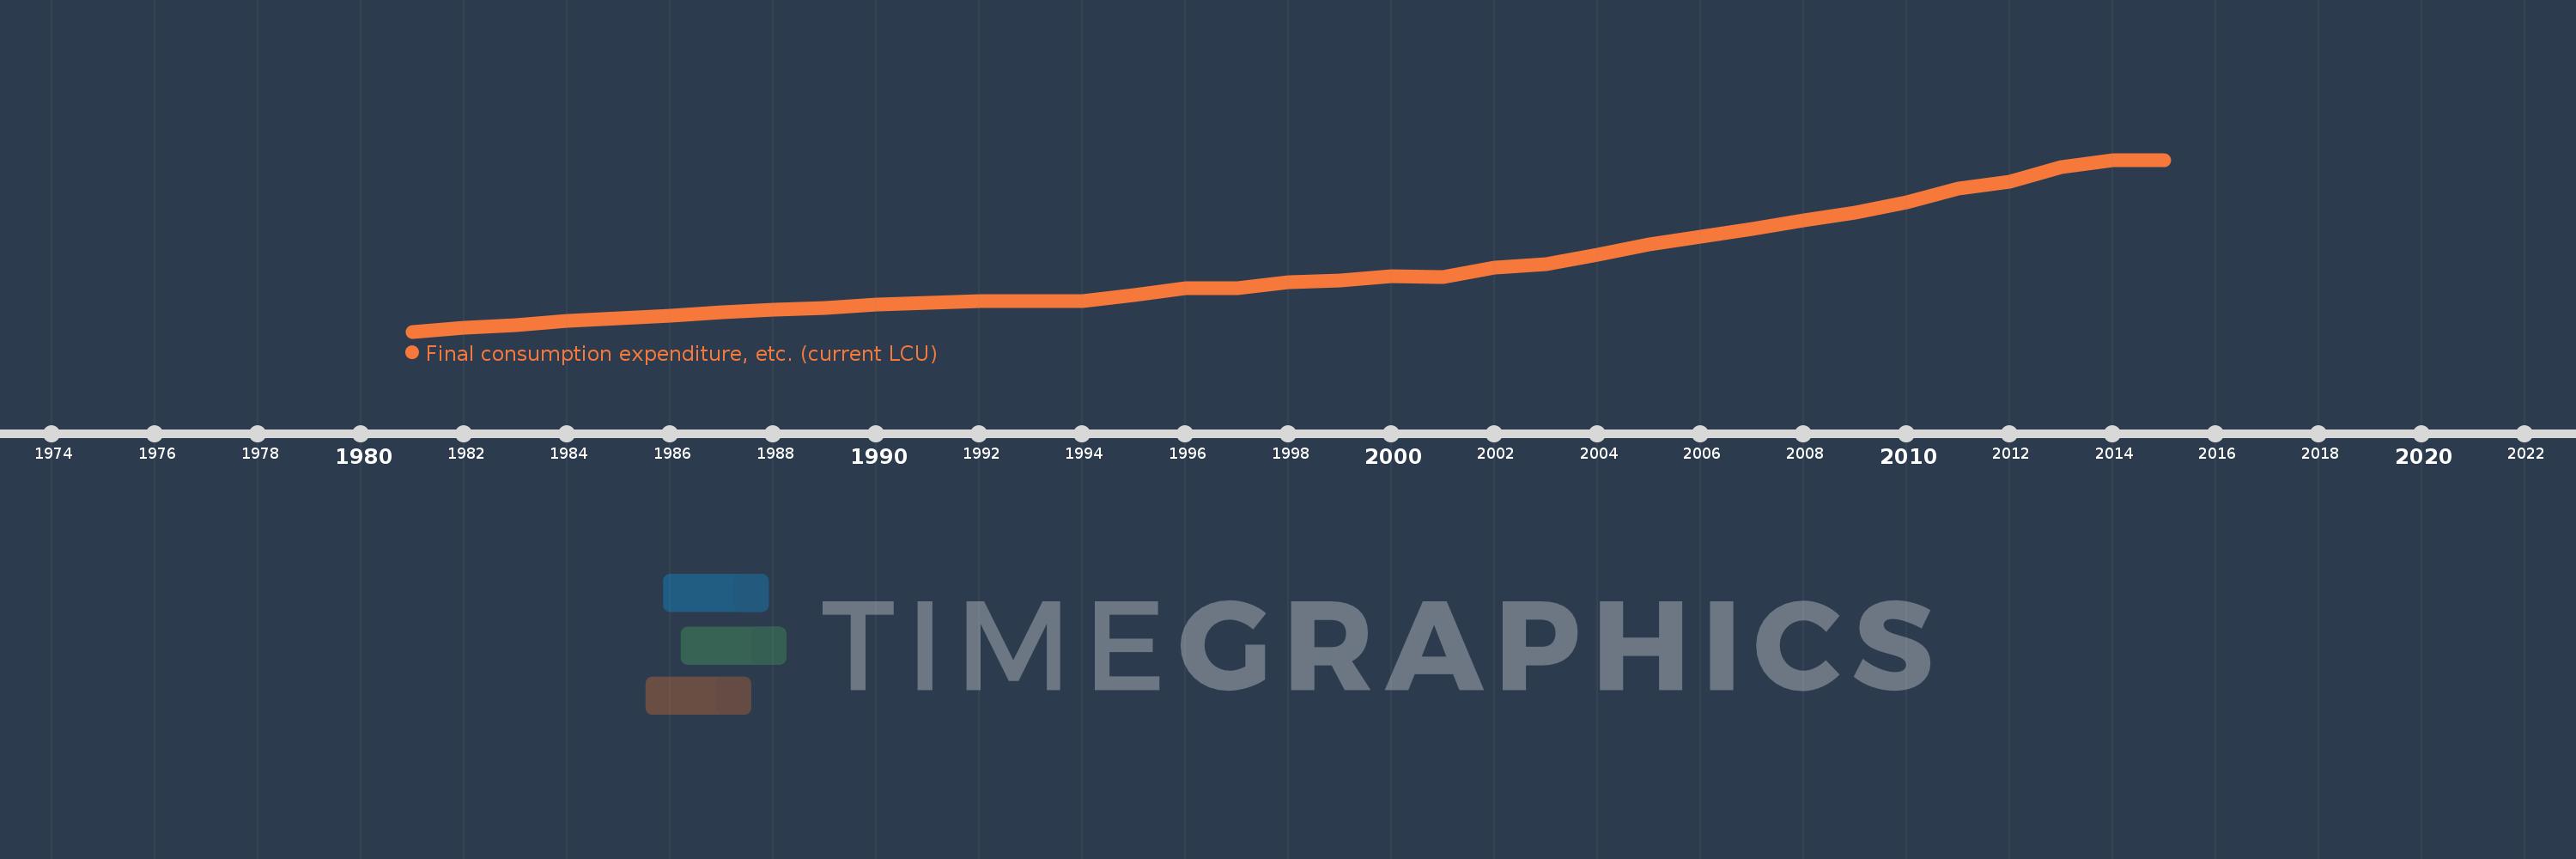
Final consumption expenditure, etc. (current LCU)
2015,2014,2013,2012,2011,2010,2009,2008,2007,2006,2005,2004,2003,2002,2001,2000,1999,1998,1997,1996,1995,1994,1993,1992,1991,1990,1989,1988,1987,1986,1985,1984,1983,1982,1981
This statistics in other country:
AfghanistanAlbaniaAlgeriaAngolaAntigua and BarbudaArgentinaArmeniaArubaAustraliaAustriaAzerbaijanBahamas, TheBahrainBangladeshBarbadosBelarusBelgiumBelizeBeninBermudaBhutanBoliviaBosnia and HerzegovinaBotswanaBrazilBrunei DarussalamBulgariaBurkina FasoBurundiCabo VerdeCambodiaCameroonCanadaCentral African RepublicChadChileChinaColombiaComorosCongo, Dem. Rep.Congo, Rep.Costa RicaCote d'IvoireCroatiaCubaCyprusCzech RepublicDenmarkDjiboutiDominicaDominican RepublicEcuadorEgypt, Arab Rep.El SalvadorEquatorial GuineaEritreaEstoniaEthiopiaFaroe IslandsFijiFinlandFranceGabonGambia, TheGeorgiaGermanyGhanaGreeceGrenadaGuatemalaGuineaGuinea-BissauGuyanaHaitiHondurasHong Kong SAR, ChinaHungaryIcelandIndiaIndonesiaIran, Islamic Rep.IraqIrelandIsraelItalyJamaicaJapanJordanKazakhstanKenyaKiribatiKorea, Rep.KosovoKuwaitKyrgyz RepublicLao PDRLatviaLebanonLesothoLiberiaLibyaLithuaniaLuxembourgMacao SAR, ChinaMacedonia, FYRMadagascarMalawiMalaysiaMaldivesMaliMaltaMauritaniaMauritiusMexicoMicronesia, Fed. Sts.MoldovaMongoliaMontenegroMoroccoMozambiqueNamibiaNepalNetherlandsNew CaledoniaNew ZealandNicaraguaNigerNigeriaNorwayOmanPakistanPanamaPapua New GuineaParaguayPeruPhilippinesPolandPortugalPuerto RicoQatarRomaniaRussian FederationRwandaSaudi ArabiaSenegalSerbiaSeychellesSierra LeoneSingaporeSlovak RepublicSloveniaSolomon IslandsSomaliaSouth AfricaSouth SudanSpainSri LankaSt. Kitts and NevisSt. LuciaSt. Vincent and the GrenadinesSudanSurinameSwazilandSwedenSwitzerlandSyrian Arab RepublicTajikistanTanzaniaThailandTimor-LesteTogoTongaTrinidad and TobagoTunisiaTurkeyTurkmenistanUgandaUkraineUnited Arab EmiratesUnited KingdomUnited StatesUruguayUzbekistanVanuatuVenezuela, RBVietnamWest Bank and GazaYemen, Rep.ZambiaZimbabwe Timeline:
This timeline shows a graph from 1981 to 2015 of Comoros. No data until 1980. Number of actual observations by date: 35.
Source name:
World Development Indicators
Source organization:
World Bank national accounts data, and OECD National Accounts data files.
Categories, topics:
Economy & Growth
Last updated:
apr 23, 2017
Indicators value changes by year
Minimum:
28.723 bln
jan 1, 1981
Maximum:
279.123 bln
jan 1, 2014
At the date of observation
Value
Absolute change
Change from previous value
jan 1, 1981
28.723 bln
+28.723 bln
0.0%
jan 1, 1982
34.301 bln
+5.578 bln
19.42%
jan 1, 1983
37.572 bln
+3.271 bln
9.54%
jan 1, 1984
44.022 bln
+6.45 bln
17.17%
jan 1, 1985
47.699 bln
+3.677 bln
8.35%
jan 1, 1986
51.574 bln
+3.875 bln
8.12%
jan 1, 1987
57.094 bln
+5.52 bln
10.7%
jan 1, 1988
60.221 bln
+3.127 bln
5.48%
jan 1, 1989
63.002 bln
+2.781 bln
4.62%
jan 1, 1990
67.842 bln
+4.84 bln
7.68%
jan 1, 1991
70.271 bln
+2.429 bln
3.58%
jan 1, 1992
73.08 bln
+2.809 bln
4.0%
jan 1, 1993
72.774 bln
-306.0 mln
-0.42%
jan 1, 1994
73.466 bln
+692.0 mln
0.95%
jan 1, 1995
82.372 bln
+8.906 bln
12.12%
jan 1, 1996
91.453 bln
+9.081 bln
11.02%
jan 1, 1997
91.648 bln
+195.0 mln
0.21%
jan 1, 1998
101.233 bln
+9.585 bln
10.46%
jan 1, 1999
102.878 bln
+1.645 bln
1.62%
jan 1, 2000
109.198 bln
+6.32 bln
6.14%
jan 1, 2001
107.613 bln
-1.585 bln
-1.45%
jan 1, 2002
122.044 bln
+14.431 bln
13.41%
jan 1, 2003
126.73 bln
+4.686 bln
3.84%
jan 1, 2004
140.975 bln
+14.245 bln
11.24%
jan 1, 2005
155.477 bln
+14.502 bln
10.29%
jan 1, 2006
166.736 bln
+11.259 bln
7.24%
jan 1, 2007
178.79 bln
+12.054 bln
7.23%
jan 1, 2008
190.918 bln
+12.128 bln
6.78%
jan 1, 2009
201.822 bln
+10.904 bln
5.71%
jan 1, 2010
216.715 bln
+14.893 bln
7.38%
jan 1, 2011
237.353 bln
+20.638 bln
9.52%
jan 1, 2012
247.523 bln
+10.17 bln
4.28%
jan 1, 2013
268.766 bln
+21.243 bln
8.58%
jan 1, 2014
279.123 bln
+10.357 bln
3.85%
jan 1, 2015
278.769 bln
-353.617 mln
-0.13%
Ranking of countries by current statistics by years


Comments: