29
/
en
AIzaSyAYiBZKx7MnpbEhh9jyipgxe19OcubqV5w
April 1, 2024
72193
Aruba
ABW
true
2
1
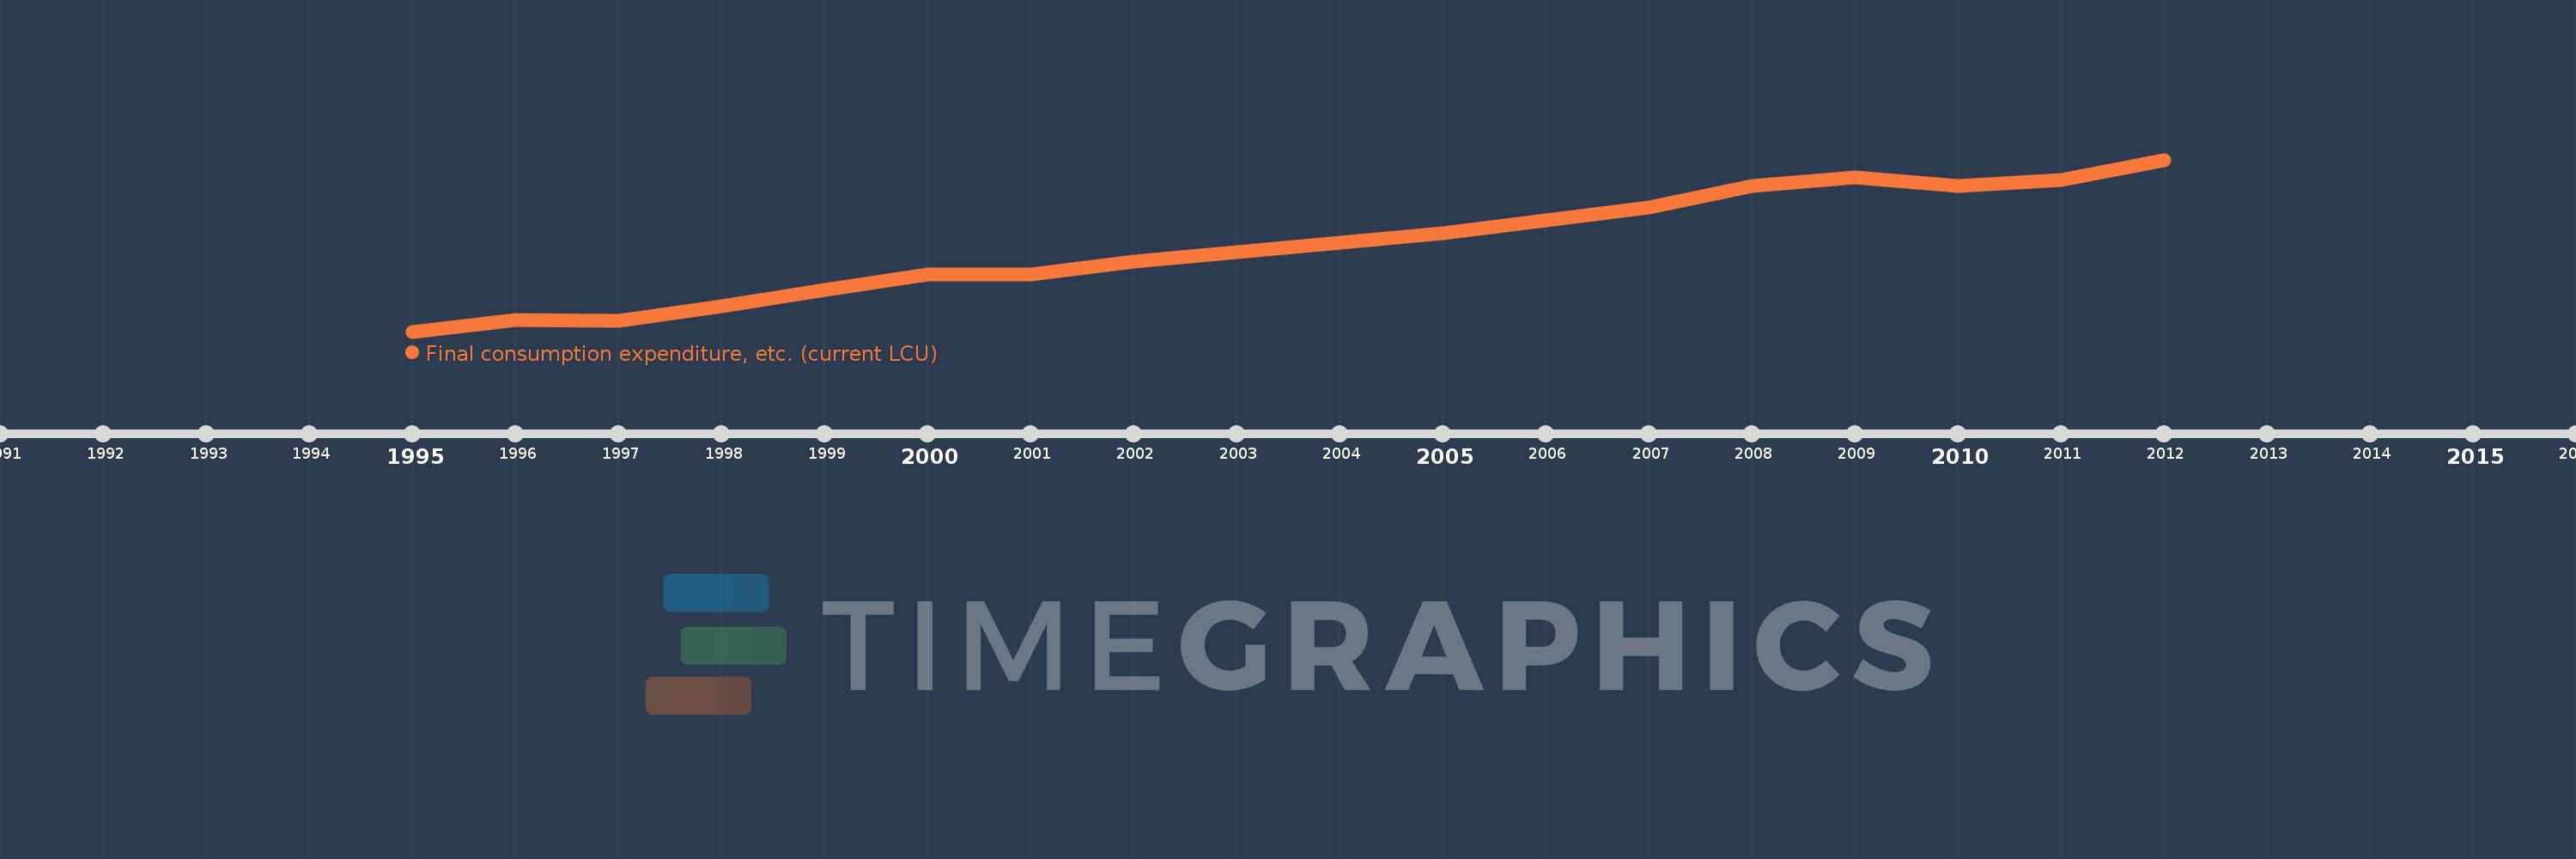
Final consumption expenditure, etc. (current LCU)
2012,2011,2010,2009,2008,2007,2006,2005,2004,2003,2002,2001,2000,1999,1998,1997,1996,1995
This statistics in other country:
AfghanistanAlbaniaAlgeriaAngolaAntigua and BarbudaArgentinaArmeniaArubaAustraliaAustriaAzerbaijanBahamas, TheBahrainBangladeshBarbadosBelarusBelgiumBelizeBeninBermudaBhutanBoliviaBosnia and HerzegovinaBotswanaBrazilBrunei DarussalamBulgariaBurkina FasoBurundiCabo VerdeCambodiaCameroonCanadaCentral African RepublicChadChileChinaColombiaComorosCongo, Dem. Rep.Congo, Rep.Costa RicaCote d'IvoireCroatiaCubaCyprusCzech RepublicDenmarkDjiboutiDominicaDominican RepublicEcuadorEgypt, Arab Rep.El SalvadorEquatorial GuineaEritreaEstoniaEthiopiaFaroe IslandsFijiFinlandFranceGabonGambia, TheGeorgiaGermanyGhanaGreeceGrenadaGuatemalaGuineaGuinea-BissauGuyanaHaitiHondurasHong Kong SAR, ChinaHungaryIcelandIndiaIndonesiaIran, Islamic Rep.IraqIrelandIsraelItalyJamaicaJapanJordanKazakhstanKenyaKiribatiKorea, Rep.KosovoKuwaitKyrgyz RepublicLao PDRLatviaLebanonLesothoLiberiaLibyaLithuaniaLuxembourgMacao SAR, ChinaMacedonia, FYRMadagascarMalawiMalaysiaMaldivesMaliMaltaMauritaniaMauritiusMexicoMicronesia, Fed. Sts.MoldovaMongoliaMontenegroMoroccoMozambiqueNamibiaNepalNetherlandsNew CaledoniaNew ZealandNicaraguaNigerNigeriaNorwayOmanPakistanPanamaPapua New GuineaParaguayPeruPhilippinesPolandPortugalPuerto RicoQatarRomaniaRussian FederationRwandaSaudi ArabiaSenegalSerbiaSeychellesSierra LeoneSingaporeSlovak RepublicSloveniaSolomon IslandsSomaliaSouth AfricaSouth SudanSpainSri LankaSt. Kitts and NevisSt. LuciaSt. Vincent and the GrenadinesSudanSurinameSwazilandSwedenSwitzerlandSyrian Arab RepublicTajikistanTanzaniaThailandTimor-LesteTogoTongaTrinidad and TobagoTunisiaTurkeyTurkmenistanUgandaUkraineUnited Arab EmiratesUnited KingdomUnited StatesUruguayUzbekistanVanuatuVenezuela, RBVietnamWest Bank and GazaYemen, Rep.ZambiaZimbabwe Timeline:
This timeline shows a graph from 1995 to 2012 of Aruba. No data until 1994. Number of actual observations by date: 18.
Source name:
World Development Indicators
Source organization:
World Bank national accounts data, and OECD National Accounts data files.
Categories, topics:
Economy & Growth
Last updated:
apr 23, 2017
Indicators value changes by year
Minimum:
1.529 bln
jan 1, 1995
Maximum:
4.056 bln
jan 1, 2012
At the date of observation
Value
Absolute change
Change from previous value
jan 1, 1995
1.529 bln
+1.529 bln
0.0%
jan 1, 1996
1.699 bln
+170.0 mln
11.12%
jan 1, 1997
1.691 bln
-8.0 mln
-0.47%
jan 1, 1998
1.899 bln
+208.0 mln
12.3%
jan 1, 1999
2.148 bln
+248.79 mln
13.1%
jan 1, 2000
2.374 bln
+225.8 mln
10.51%
jan 1, 2001
2.374 bln
+900.0K
0.04%
jan 1, 2002
2.555 bln
+180.93 mln
7.62%
jan 1, 2003
2.695 bln
+139.15 mln
5.45%
jan 1, 2004
2.842 bln
+147.1 mln
5.46%
jan 1, 2005
2.98 bln
+137.91 mln
4.85%
jan 1, 2006
3.163 bln
+183.68 mln
6.16%
jan 1, 2007
3.349 bln
+186.16 mln
5.89%
jan 1, 2008
3.67 bln
+320.33 mln
9.56%
jan 1, 2009
3.797 bln
+127.22 mln
3.47%
jan 1, 2010
3.677 bln
-120.21 mln
-3.17%
jan 1, 2011
3.763 bln
+86.35 mln
2.35%
jan 1, 2012
4.056 bln
+293.19 mln
7.79%
Ranking of countries by current statistics by years


Comments: