29
/
en
AIzaSyAYiBZKx7MnpbEhh9jyipgxe19OcubqV5w
April 1, 2024
239253
Sierra Leone
SLE
true
2
1
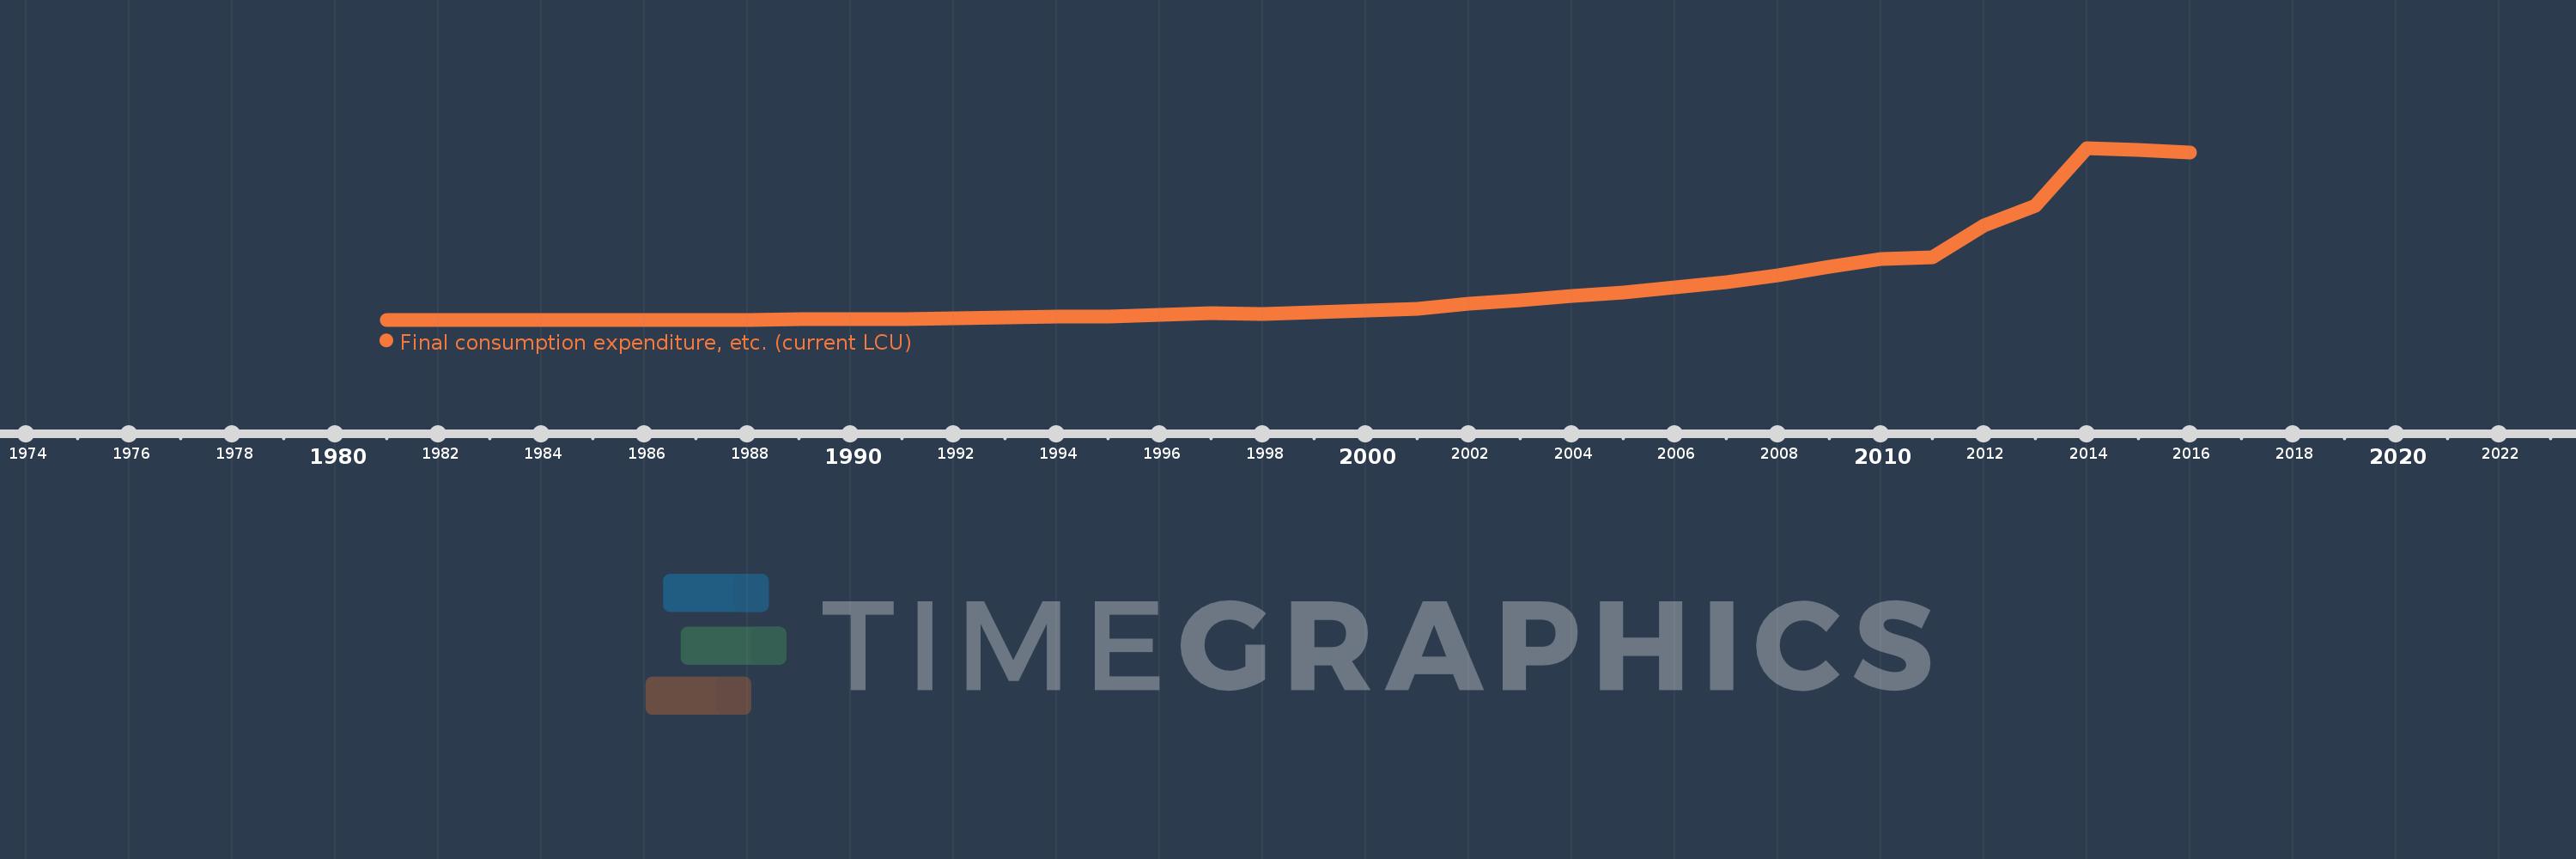
Final consumption expenditure, etc. (current LCU)
2016,2015,2014,2013,2012,2011,2010,2009,2008,2007,2006,2005,2004,2003,2002,2001,2000,1999,1998,1997,1996,1995,1994,1993,1992,1991,1990,1989,1988,1987,1986,1985,1984,1983,1982,1981
This statistics in other country:
AfghanistanAlbaniaAlgeriaAngolaAntigua and BarbudaArgentinaArmeniaArubaAustraliaAustriaAzerbaijanBahamas, TheBahrainBangladeshBarbadosBelarusBelgiumBelizeBeninBermudaBhutanBoliviaBosnia and HerzegovinaBotswanaBrazilBrunei DarussalamBulgariaBurkina FasoBurundiCabo VerdeCambodiaCameroonCanadaCentral African RepublicChadChileChinaColombiaComorosCongo, Dem. Rep.Congo, Rep.Costa RicaCote d'IvoireCroatiaCubaCyprusCzech RepublicDenmarkDjiboutiDominicaDominican RepublicEcuadorEgypt, Arab Rep.El SalvadorEquatorial GuineaEritreaEstoniaEthiopiaFaroe IslandsFijiFinlandFranceGabonGambia, TheGeorgiaGermanyGhanaGreeceGrenadaGuatemalaGuineaGuinea-BissauGuyanaHaitiHondurasHong Kong SAR, ChinaHungaryIcelandIndiaIndonesiaIran, Islamic Rep.IraqIrelandIsraelItalyJamaicaJapanJordanKazakhstanKenyaKiribatiKorea, Rep.KosovoKuwaitKyrgyz RepublicLao PDRLatviaLebanonLesothoLiberiaLibyaLithuaniaLuxembourgMacao SAR, ChinaMacedonia, FYRMadagascarMalawiMalaysiaMaldivesMaliMaltaMauritaniaMauritiusMexicoMicronesia, Fed. Sts.MoldovaMongoliaMontenegroMoroccoMozambiqueNamibiaNepalNetherlandsNew CaledoniaNew ZealandNicaraguaNigerNigeriaNorwayOmanPakistanPanamaPapua New GuineaParaguayPeruPhilippinesPolandPortugalPuerto RicoQatarRomaniaRussian FederationRwandaSaudi ArabiaSenegalSerbiaSeychellesSierra LeoneSingaporeSlovak RepublicSloveniaSolomon IslandsSomaliaSouth AfricaSouth SudanSpainSri LankaSt. Kitts and NevisSt. LuciaSt. Vincent and the GrenadinesSudanSurinameSwazilandSwedenSwitzerlandSyrian Arab RepublicTajikistanTanzaniaThailandTimor-LesteTogoTongaTrinidad and TobagoTunisiaTurkeyTurkmenistanUgandaUkraineUnited Arab EmiratesUnited KingdomUnited StatesUruguayUzbekistanVanuatuVenezuela, RBVietnamWest Bank and GazaYemen, Rep.ZambiaZimbabwe Timeline:
This timeline shows a graph from 1981 to 2016 of Sierra Leone. No data until 1980. Number of actual observations by date: 36.
Source name:
World Development Indicators
Source organization:
World Bank national accounts data, and OECD National Accounts data files.
Categories, topics:
Economy & Growth
Last updated:
apr 23, 2017
Indicators value changes by year
Minimum:
1.146 bln
jan 1, 1981
Maximum:
24.822 trl
jan 1, 2014
At the date of observation
Value
Absolute change
Change from previous value
jan 1, 1981
1.146 bln
+1.146 bln
0.0%
jan 1, 1982
1.262 bln
+116.0 mln
10.13%
jan 1, 1983
1.553 bln
+291.5 mln
23.11%
jan 1, 1984
1.814 bln
+260.8 mln
16.79%
jan 1, 1985
2.431 bln
+617.4 mln
34.04%
jan 1, 1986
3.966 bln
+1.535 bln
63.13%
jan 1, 1987
7.293 bln
+3.327 bln
83.88%
jan 1, 1988
18.211 bln
+10.918 bln
149.71%
jan 1, 1989
27.366 bln
+9.155 bln
50.27%
jan 1, 1990
47.672 bln
+20.306 bln
74.2%
jan 1, 1991
84.912 bln
+37.24 bln
78.12%
jan 1, 1992
200.039 bln
+115.127 bln
135.58%
jan 1, 1993
315.62 bln
+115.581 bln
57.78%
jan 1, 1994
421.234 bln
+105.614 bln
33.46%
jan 1, 1995
468.0 bln
+46.766 bln
11.1%
jan 1, 1996
672.587 bln
+204.587 bln
43.72%
jan 1, 1997
898.875 bln
+226.288 bln
33.64%
jan 1, 1998
870.397 bln
-28.478 bln
-3.17%
jan 1, 1999
1.071 trl
+200.864 bln
23.08%
jan 1, 2000
1.278 trl
+206.496 bln
19.28%
jan 1, 2001
1.599 trl
+320.792 bln
25.11%
jan 1, 2002
2.336 trl
+737.748 bln
46.15%
jan 1, 2003
2.854 trl
+517.327 bln
22.14%
jan 1, 2004
3.442 trl
+588.814 bln
20.63%
jan 1, 2005
3.957 trl
+514.532 bln
14.95%
jan 1, 2006
4.724 trl
+767.226 bln
19.39%
jan 1, 2007
5.461 trl
+736.679 bln
15.59%
jan 1, 2008
6.42 trl
+959.111 bln
17.56%
jan 1, 2009
7.699 trl
+1.279 trl
19.92%
jan 1, 2010
8.799 trl
+1.101 trl
14.29%
jan 1, 2011
9.035 trl
+235.315 bln
2.67%
jan 1, 2012
13.584 trl
+4.55 trl
50.36%
jan 1, 2013
16.513 trl
+2.929 trl
21.56%
jan 1, 2014
24.822 trl
+8.308 trl
50.31%
jan 1, 2015
24.499 trl
-322.324 bln
-1.3%
jan 1, 2016
24.119 trl
-380.205 bln
-1.55%
Ranking of countries by current statistics by years


Comments: